Product metrics to track for LLM apps
May 08, 2024


LLM-powered apps differ in three key ways when compared to regular SaaS apps:
- Costs are closely tied to app usage.
- Request latency spikes and errors are more common.
- LLM output is unpredictable and can lead to a negative user experience.
This means that in addition to regular product metrics, you need to monitor LLM-specific ones too. To understand which ones to track, we've put together a list of useful metrics.
The metrics are grouped into three categories: cost, usage, and debugging.
💡 PostHog tip: Use our Langfuse and Helicone integrations to bring your LLM data into PostHog. Alternatively, we have tutorials on how to capture LLM events from OpenAI, Anthropic, and Cohere.
Cost-related metrics
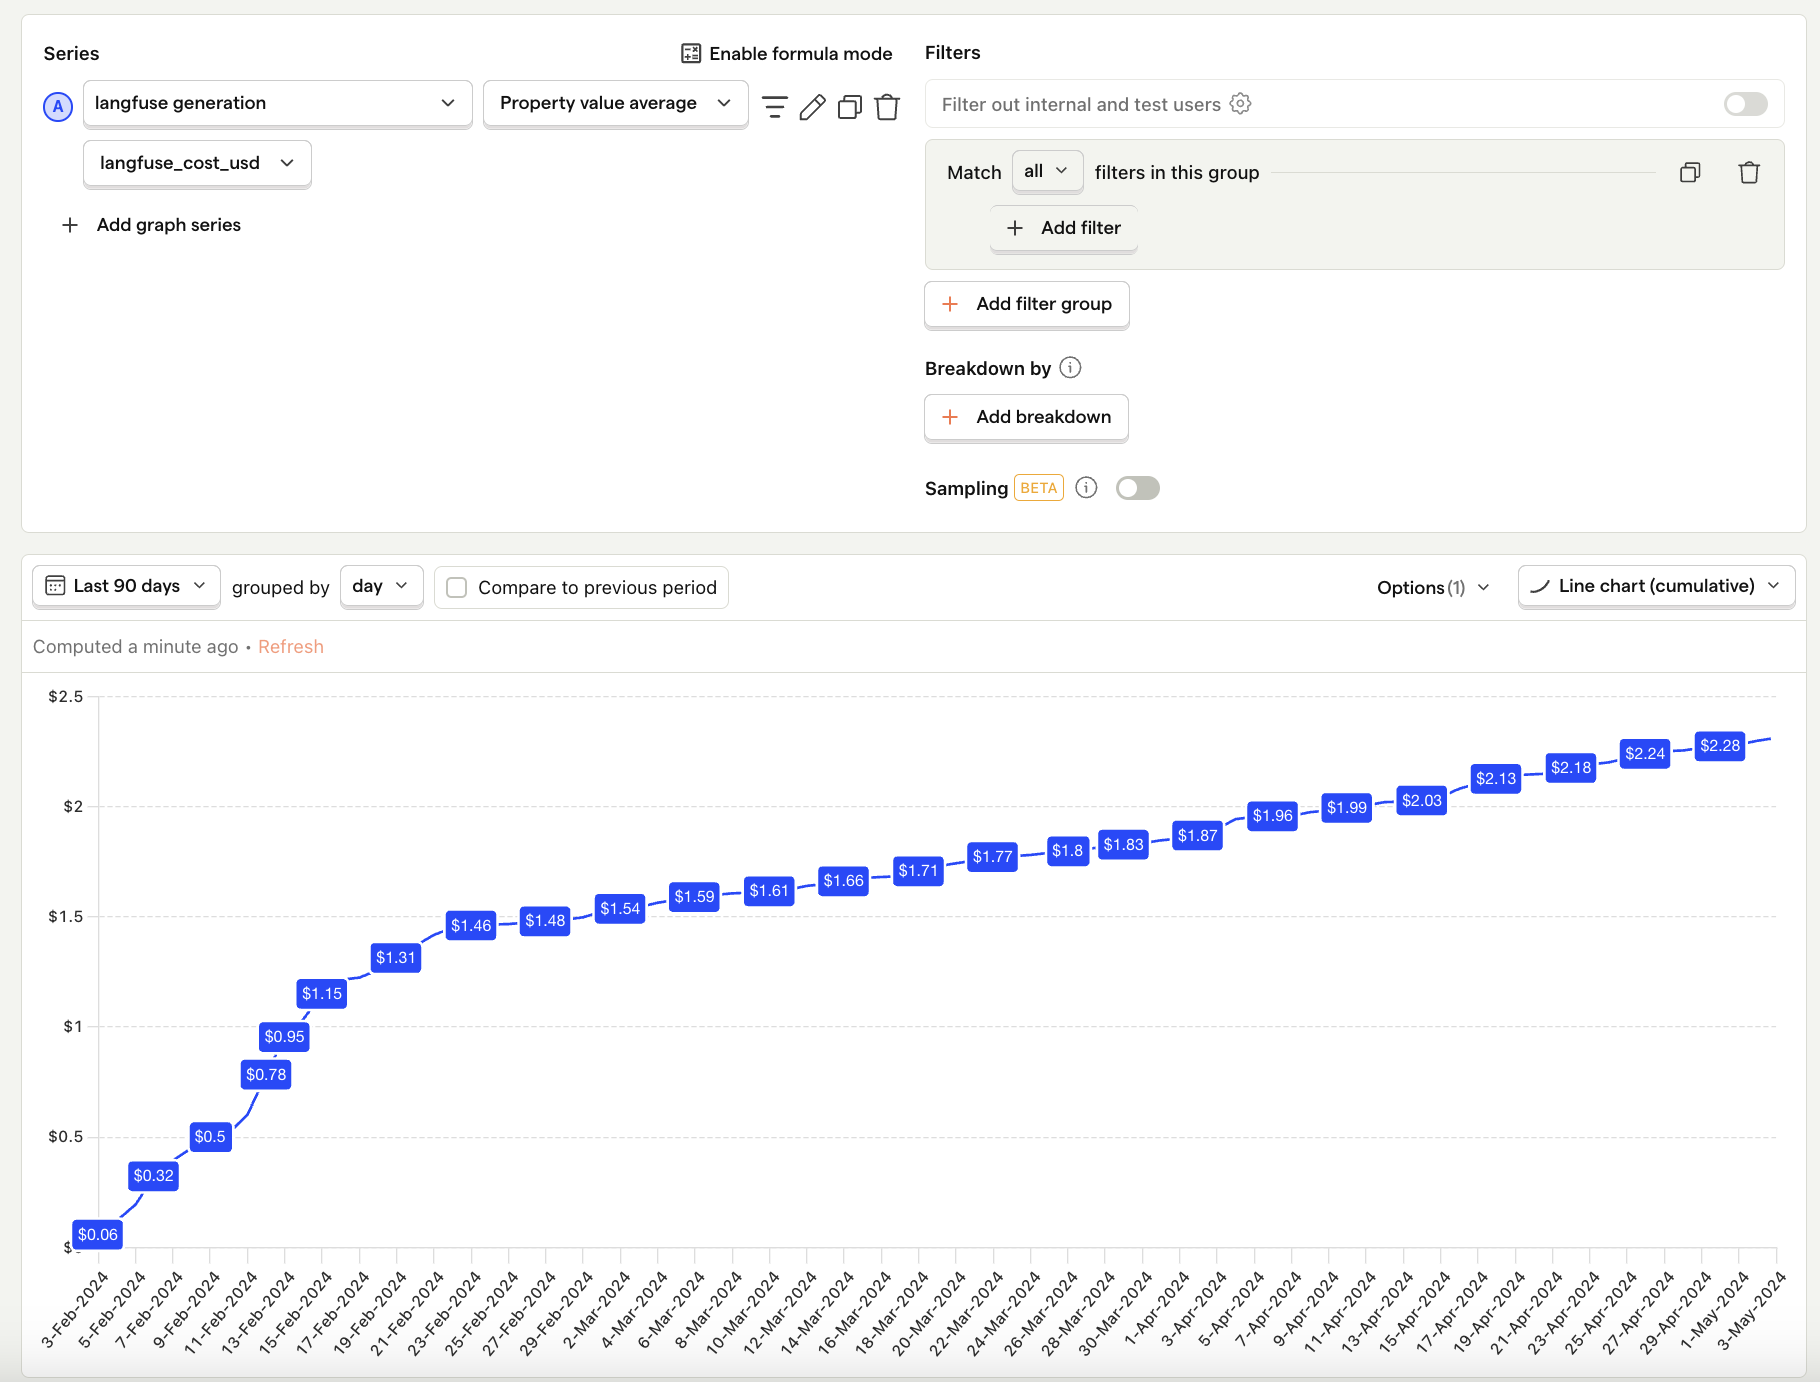
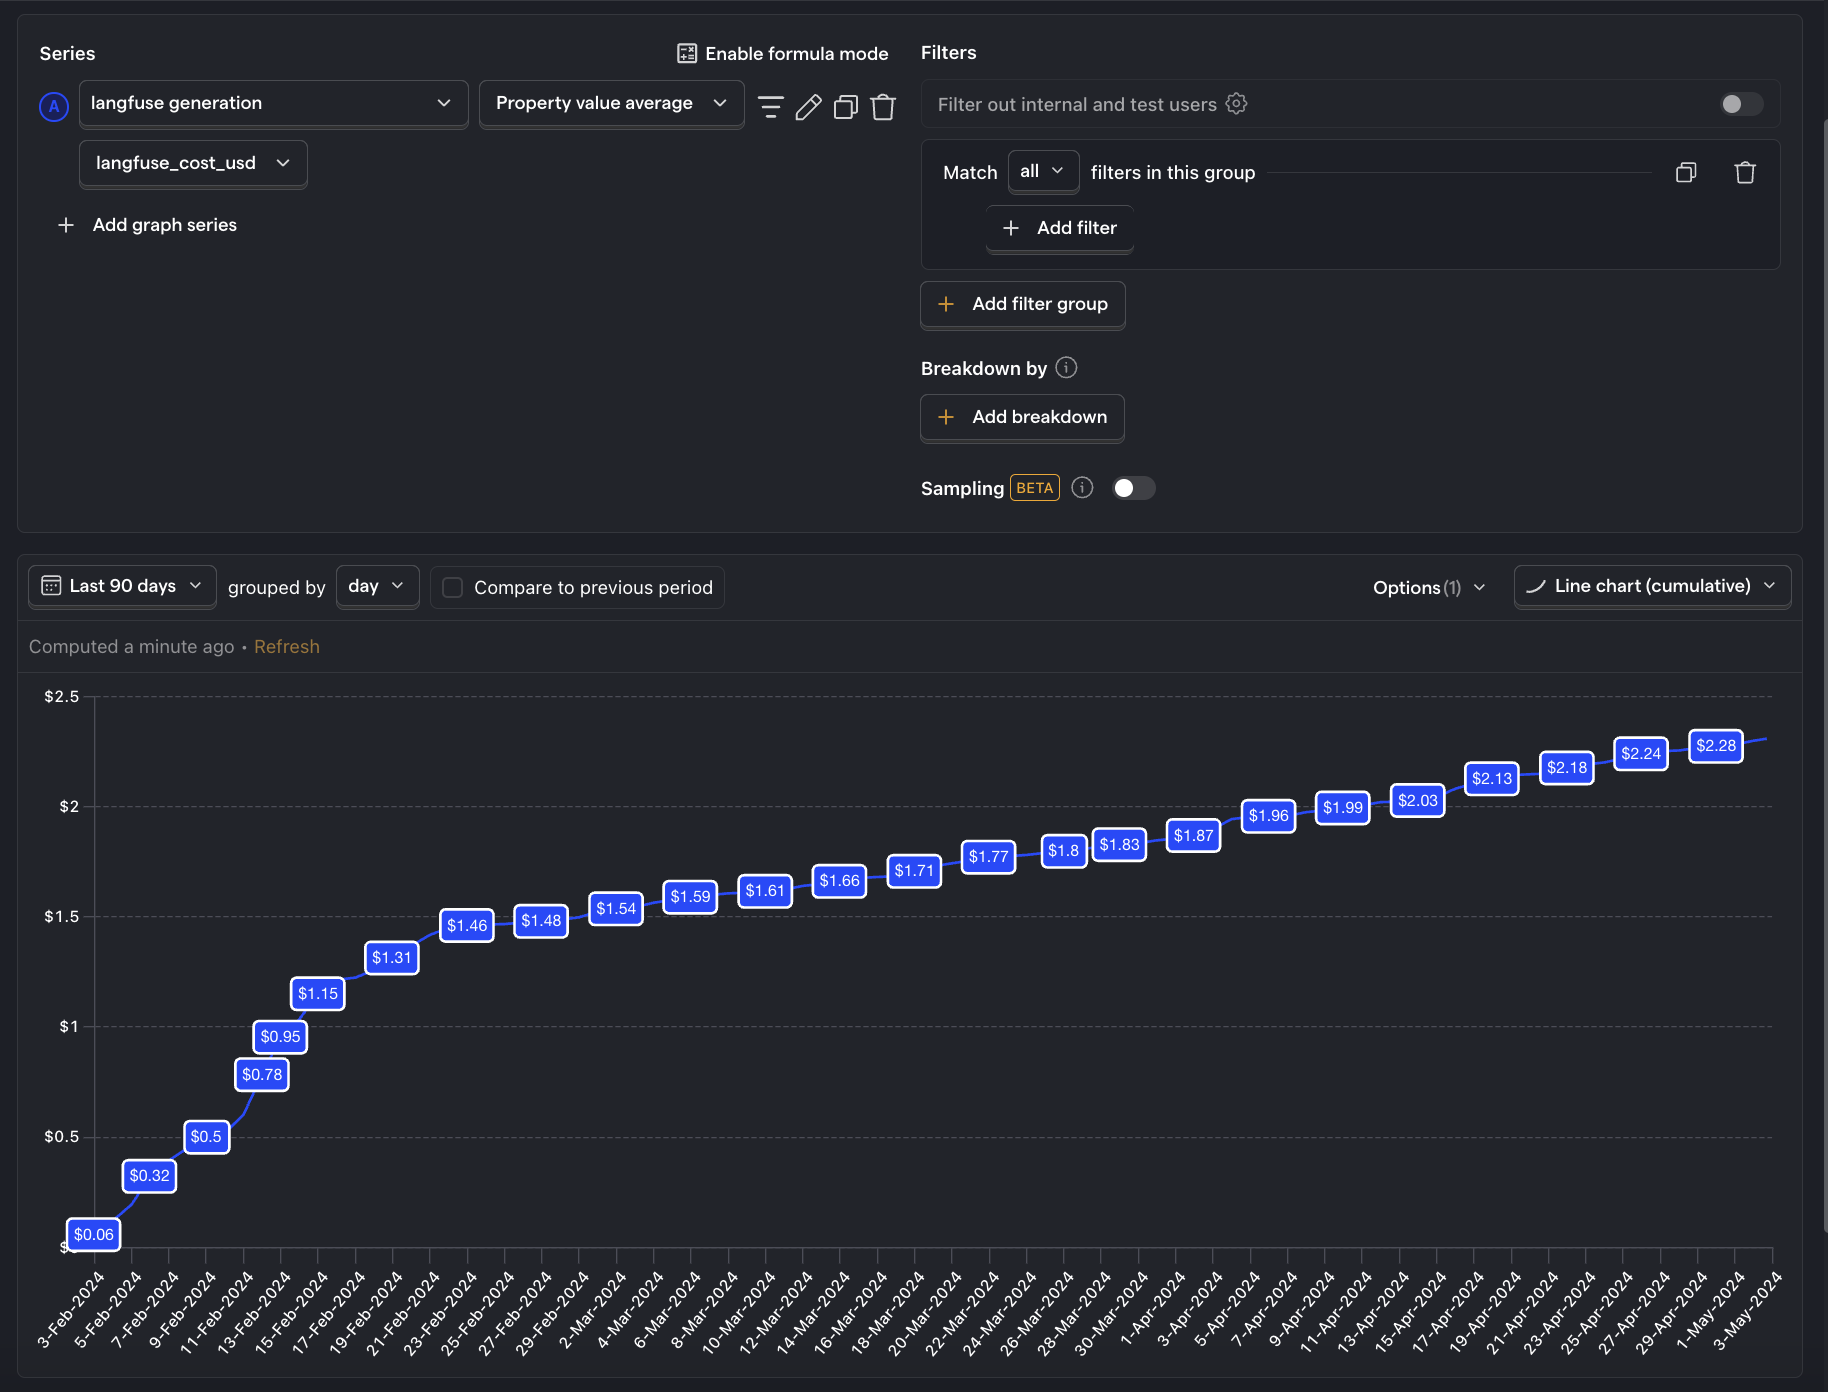
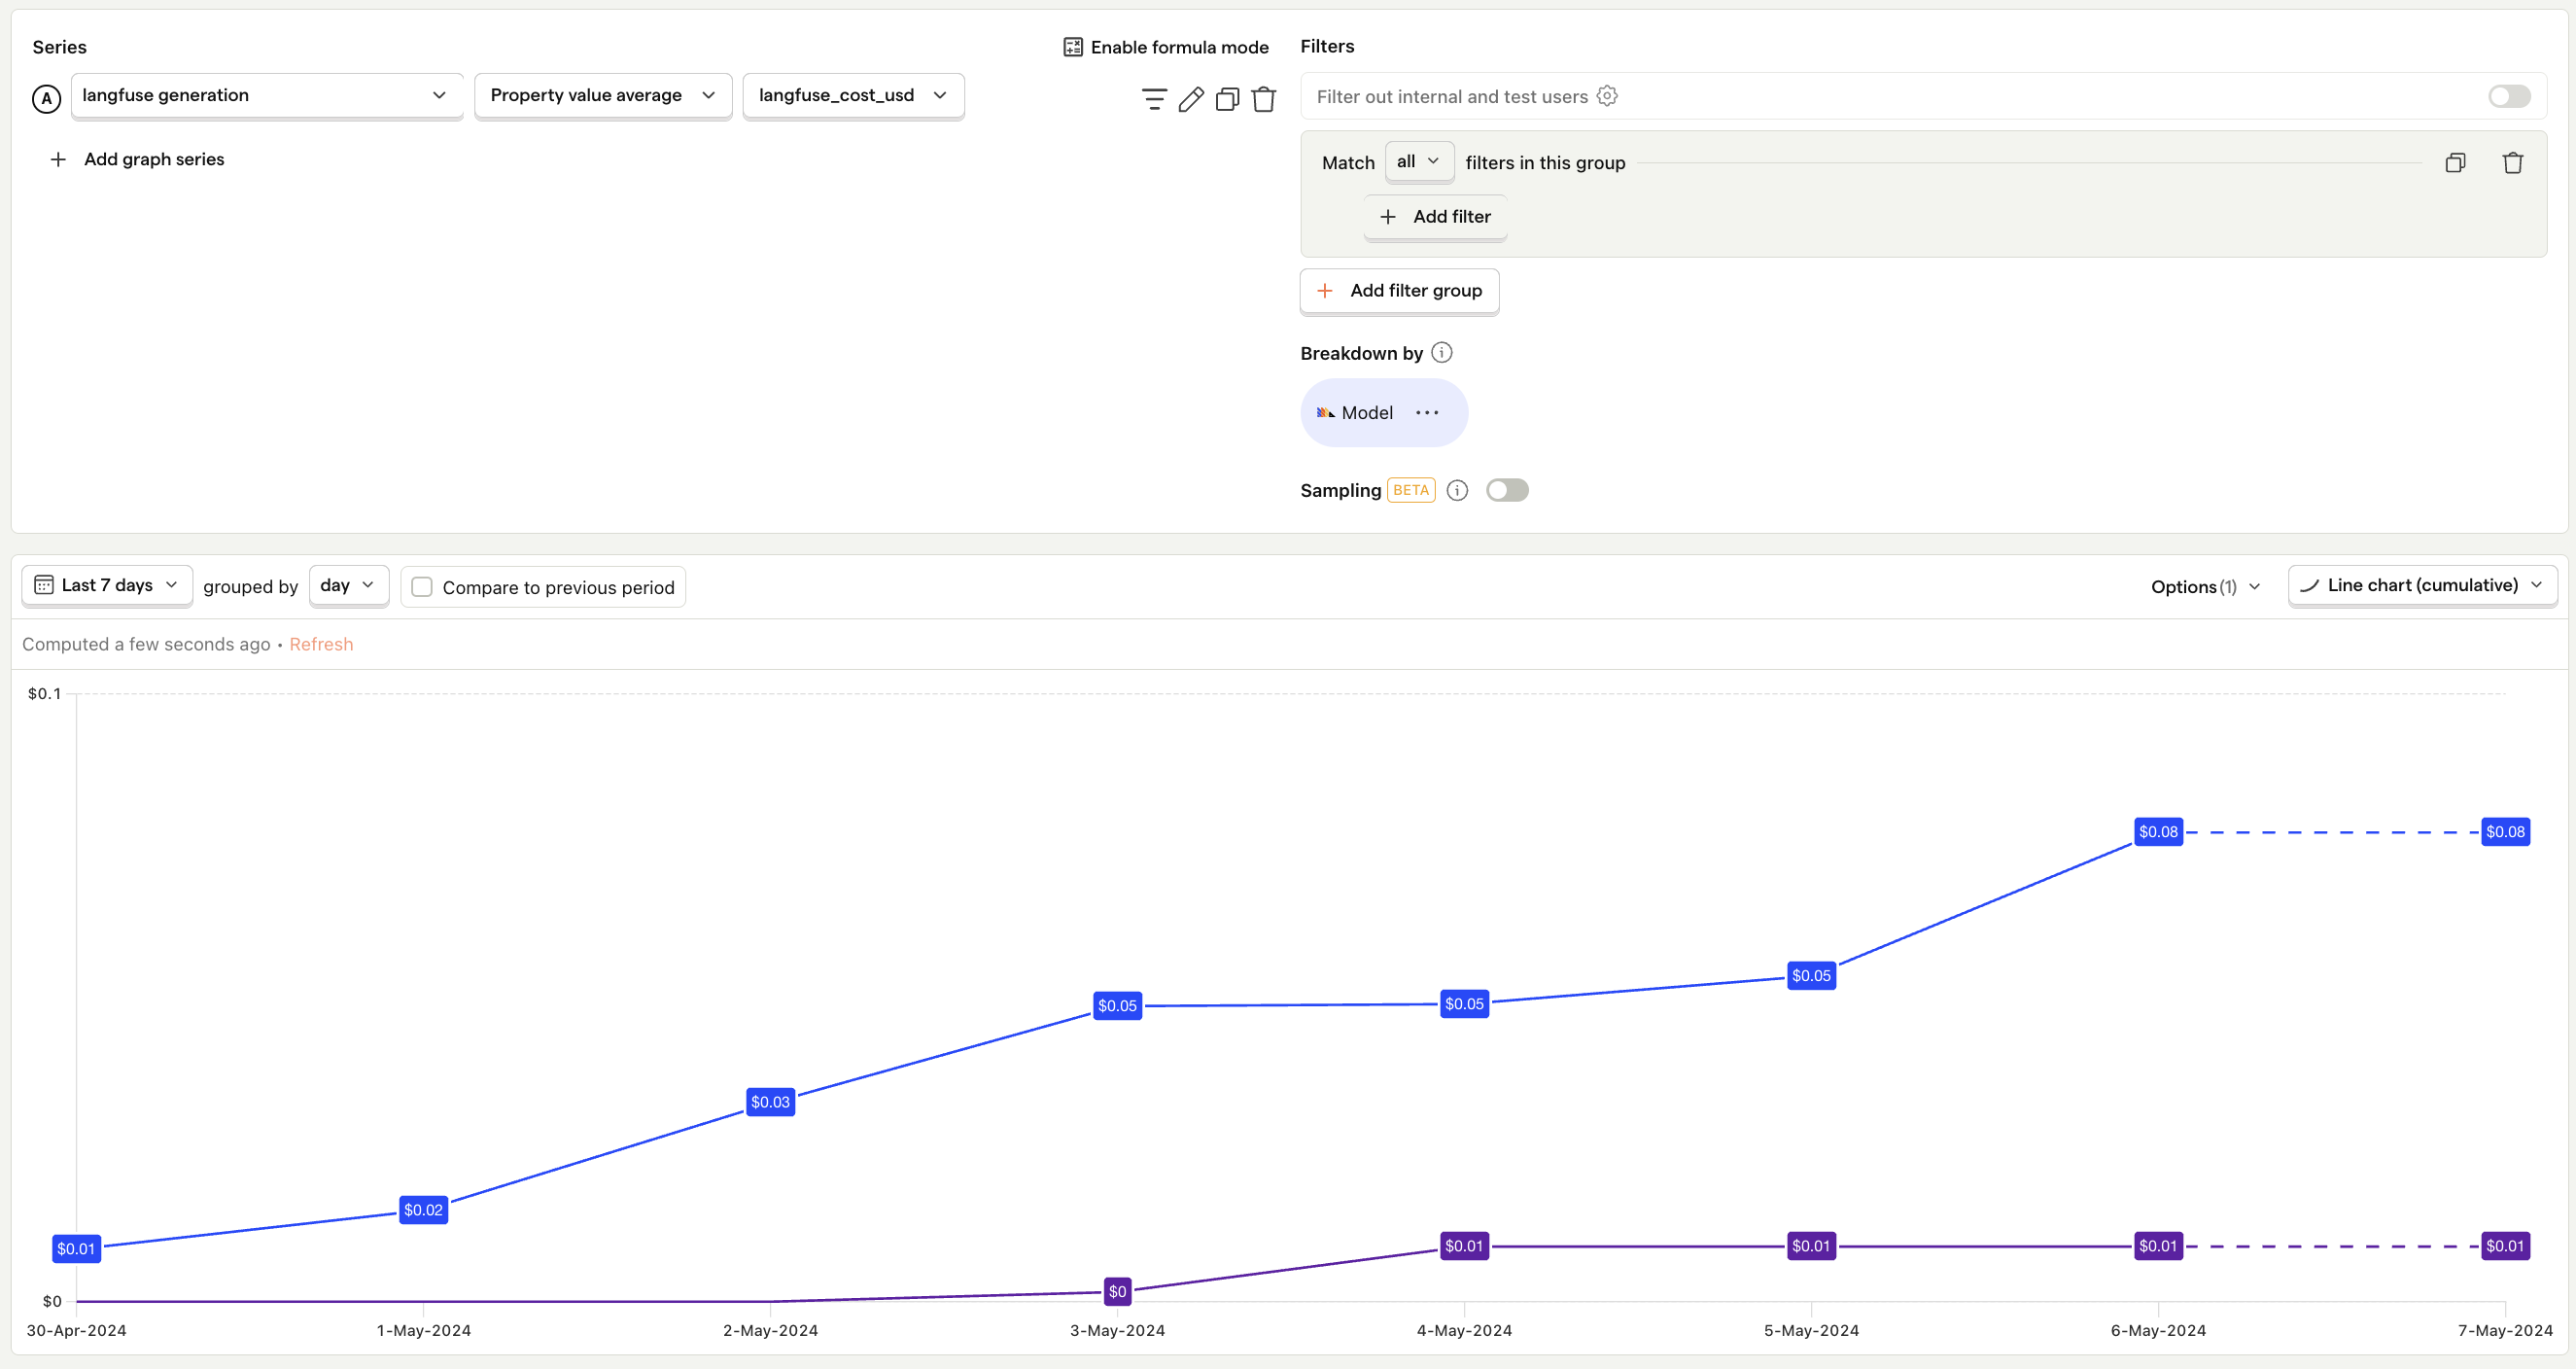
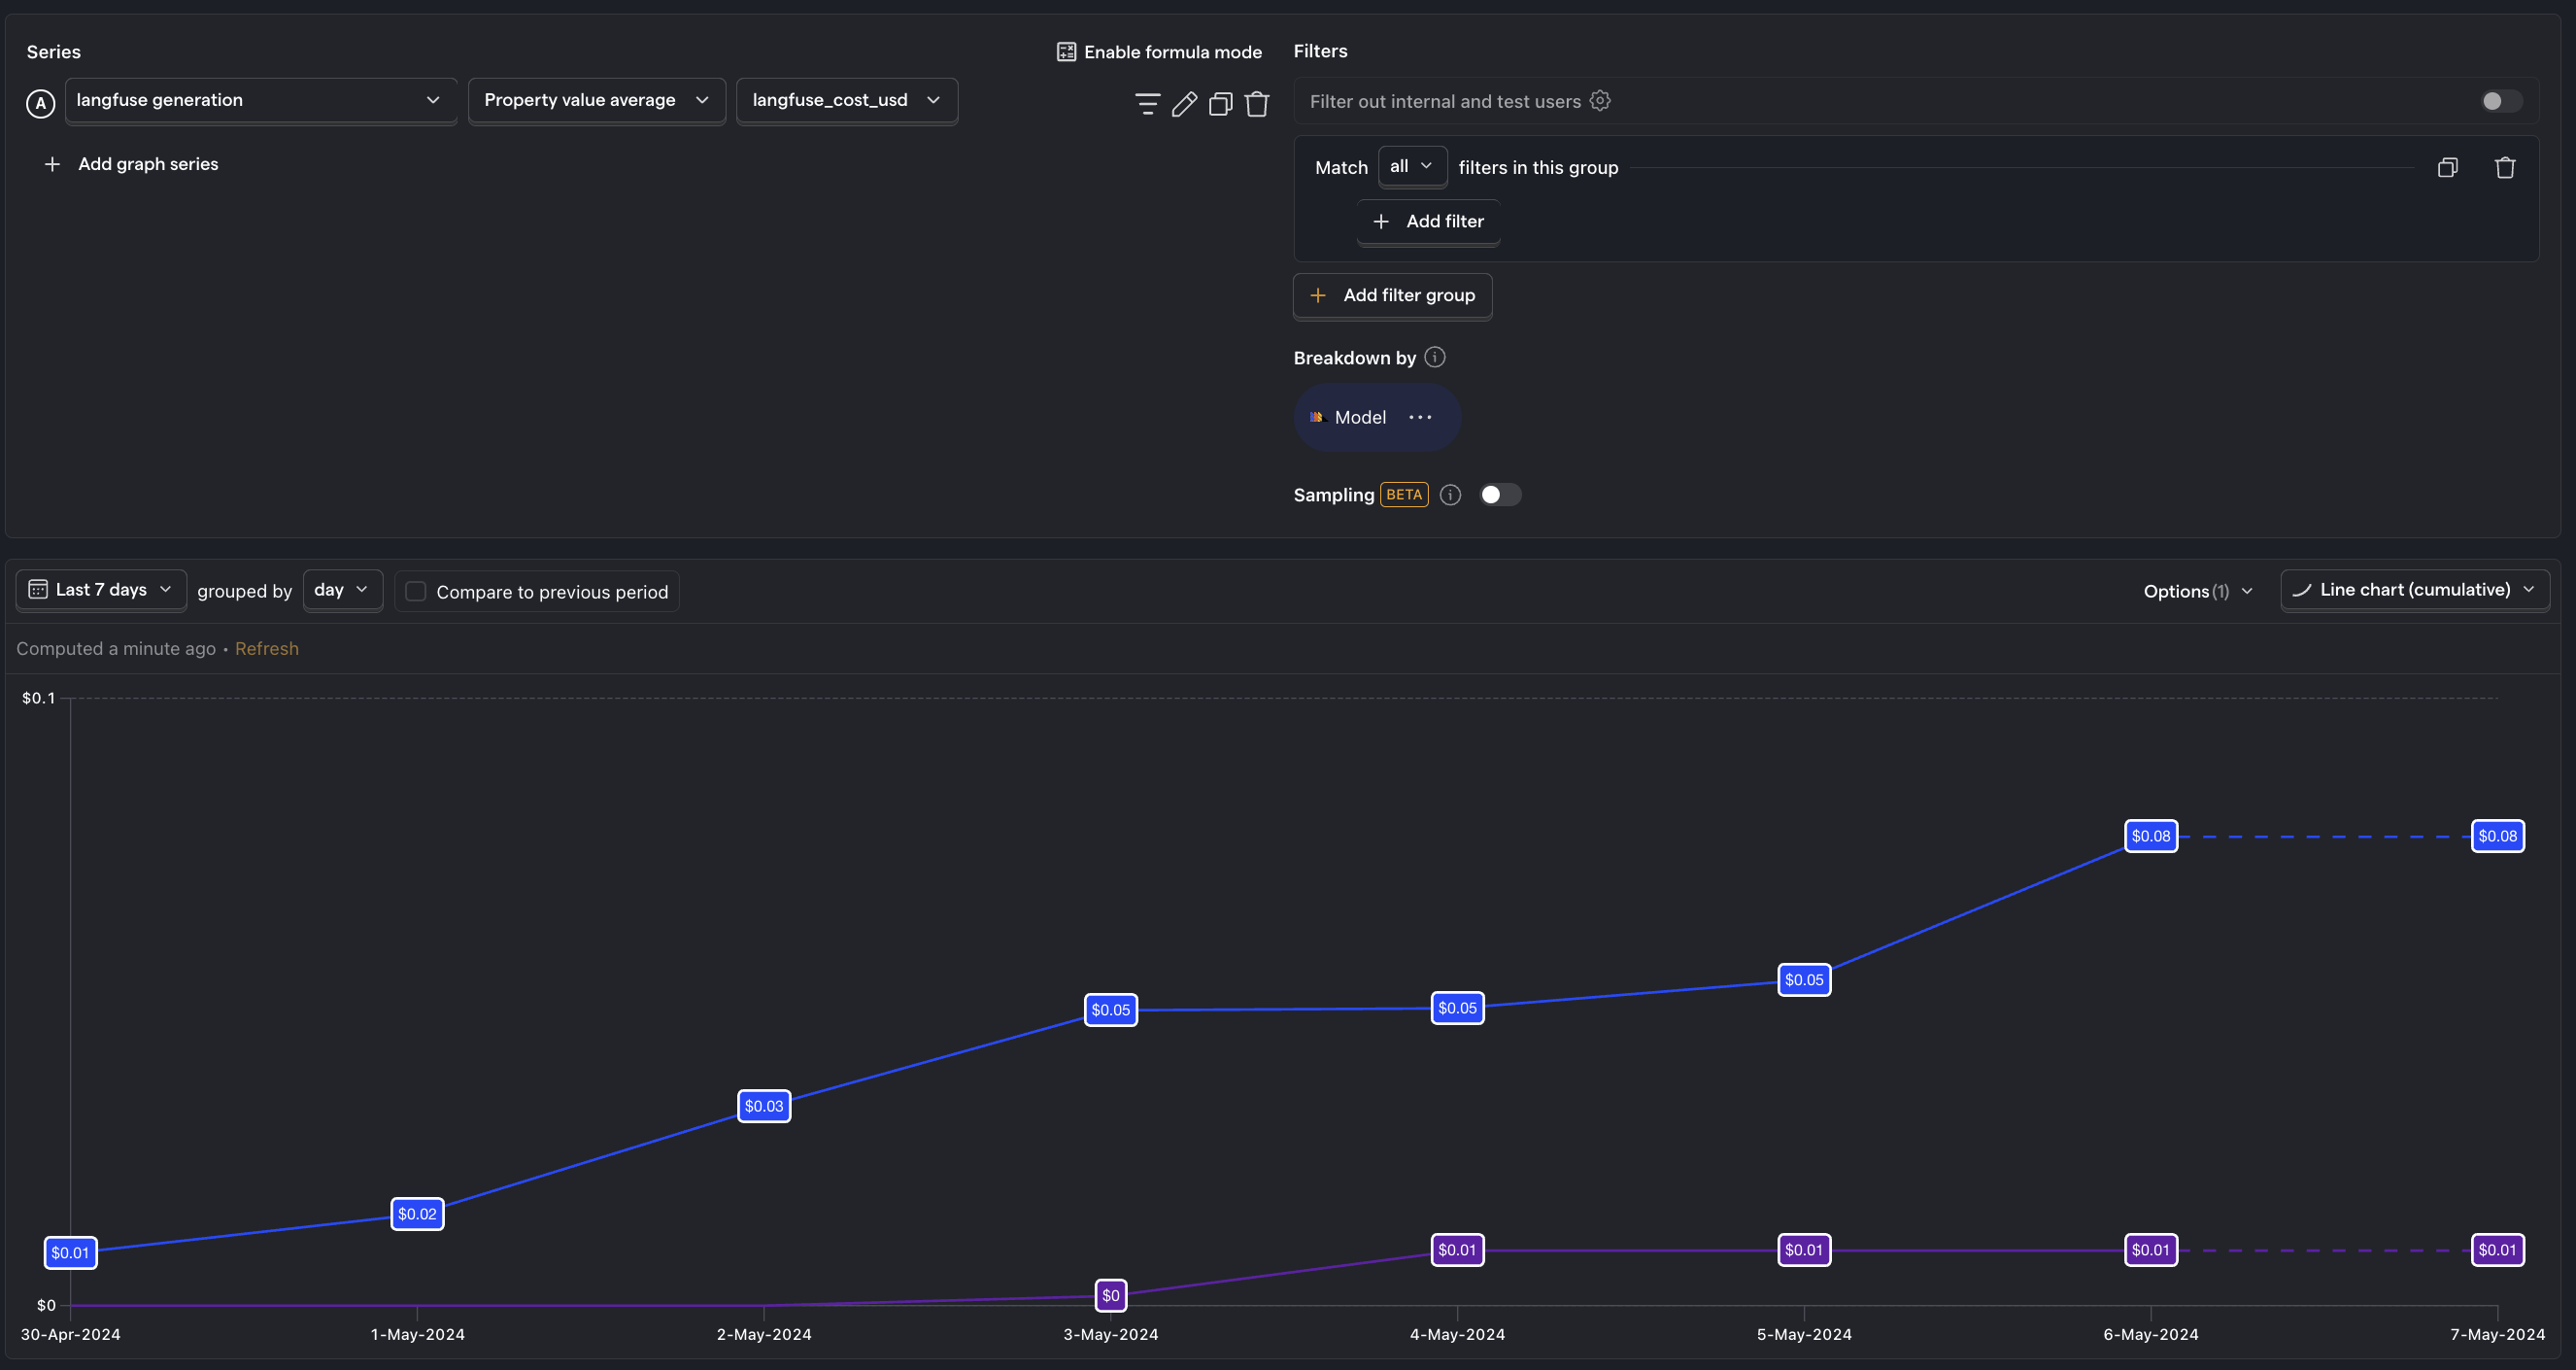
Average cost per user
What is it? Your total LLM costs divided by the number of active users.
Why it's useful: Shows how your costs will grow with product usage. You can also compare this to revenue per user to understand if your profit margin is viable.
Questions to ask:
- Are average costs going up or down over time?
- If they're increasing over time, is it because of increased product usage or increased generation costs?
- Are you charging enough to have margin for the rest of your business?
- Should you consider other LLMs with lower costs?
- What specific features or types of interactions contribute the most to the cost per user?
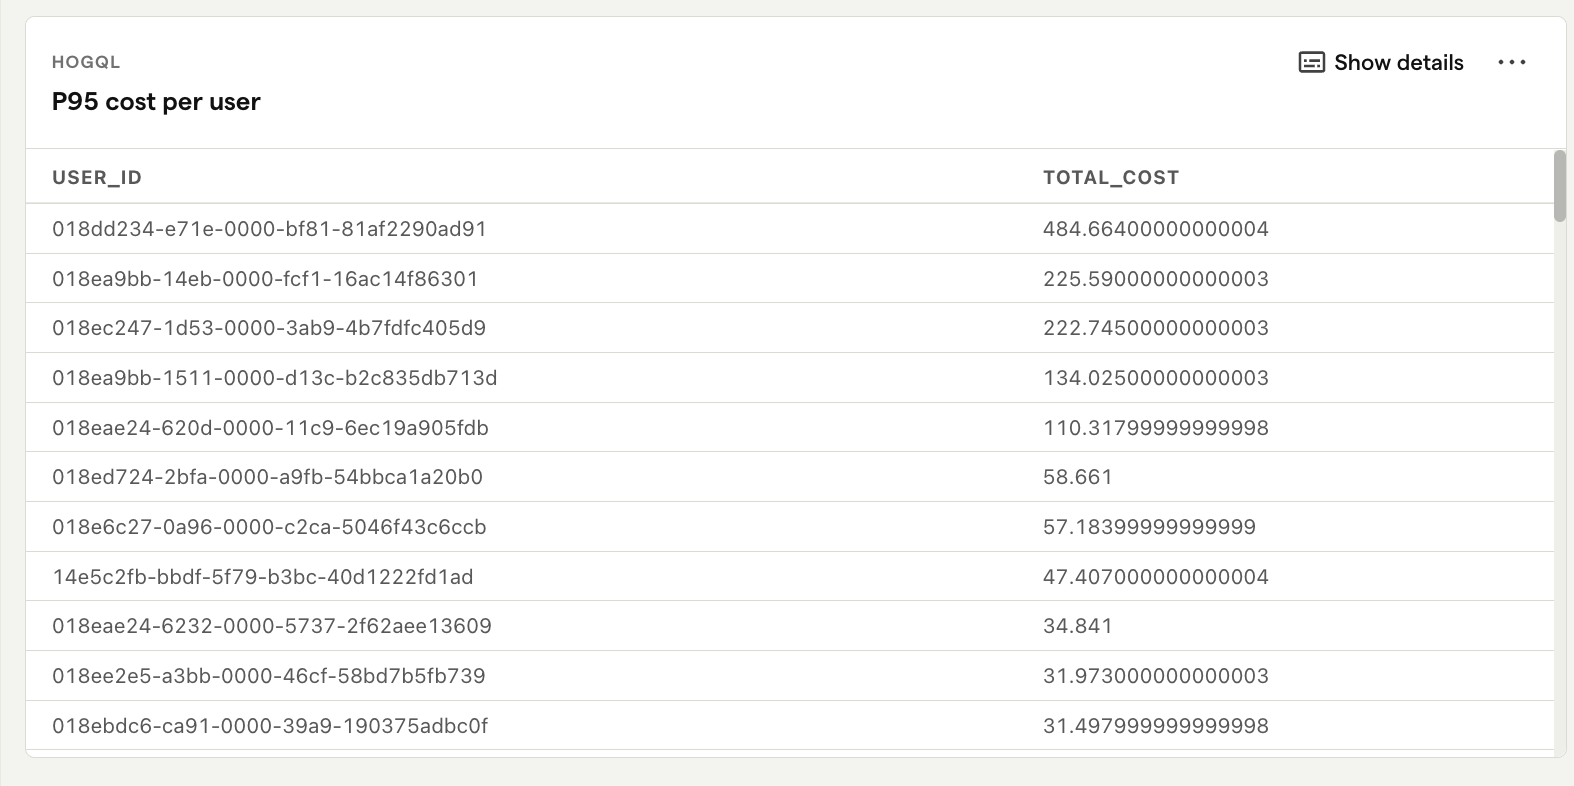
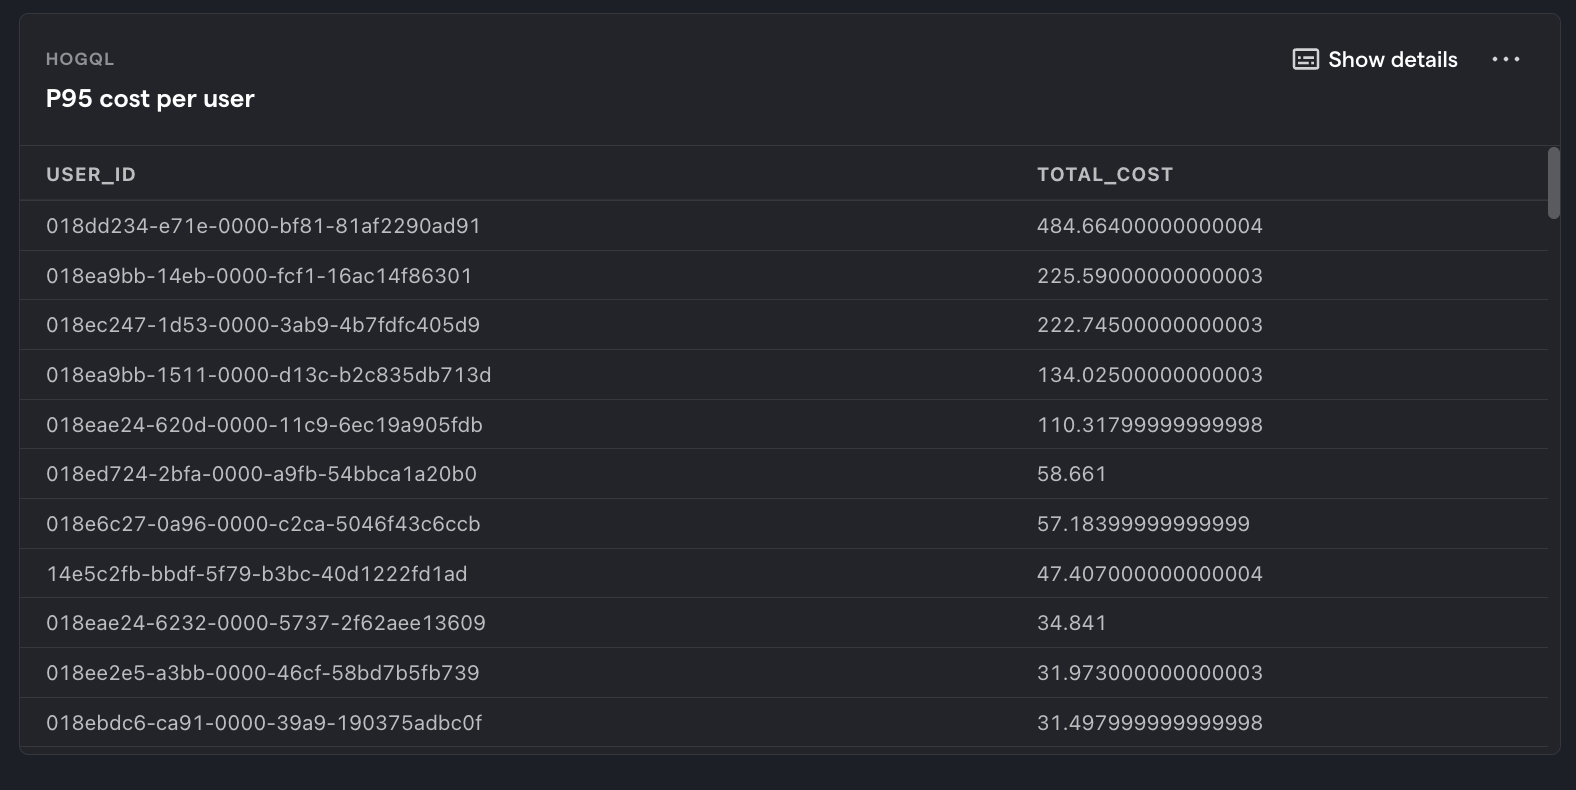
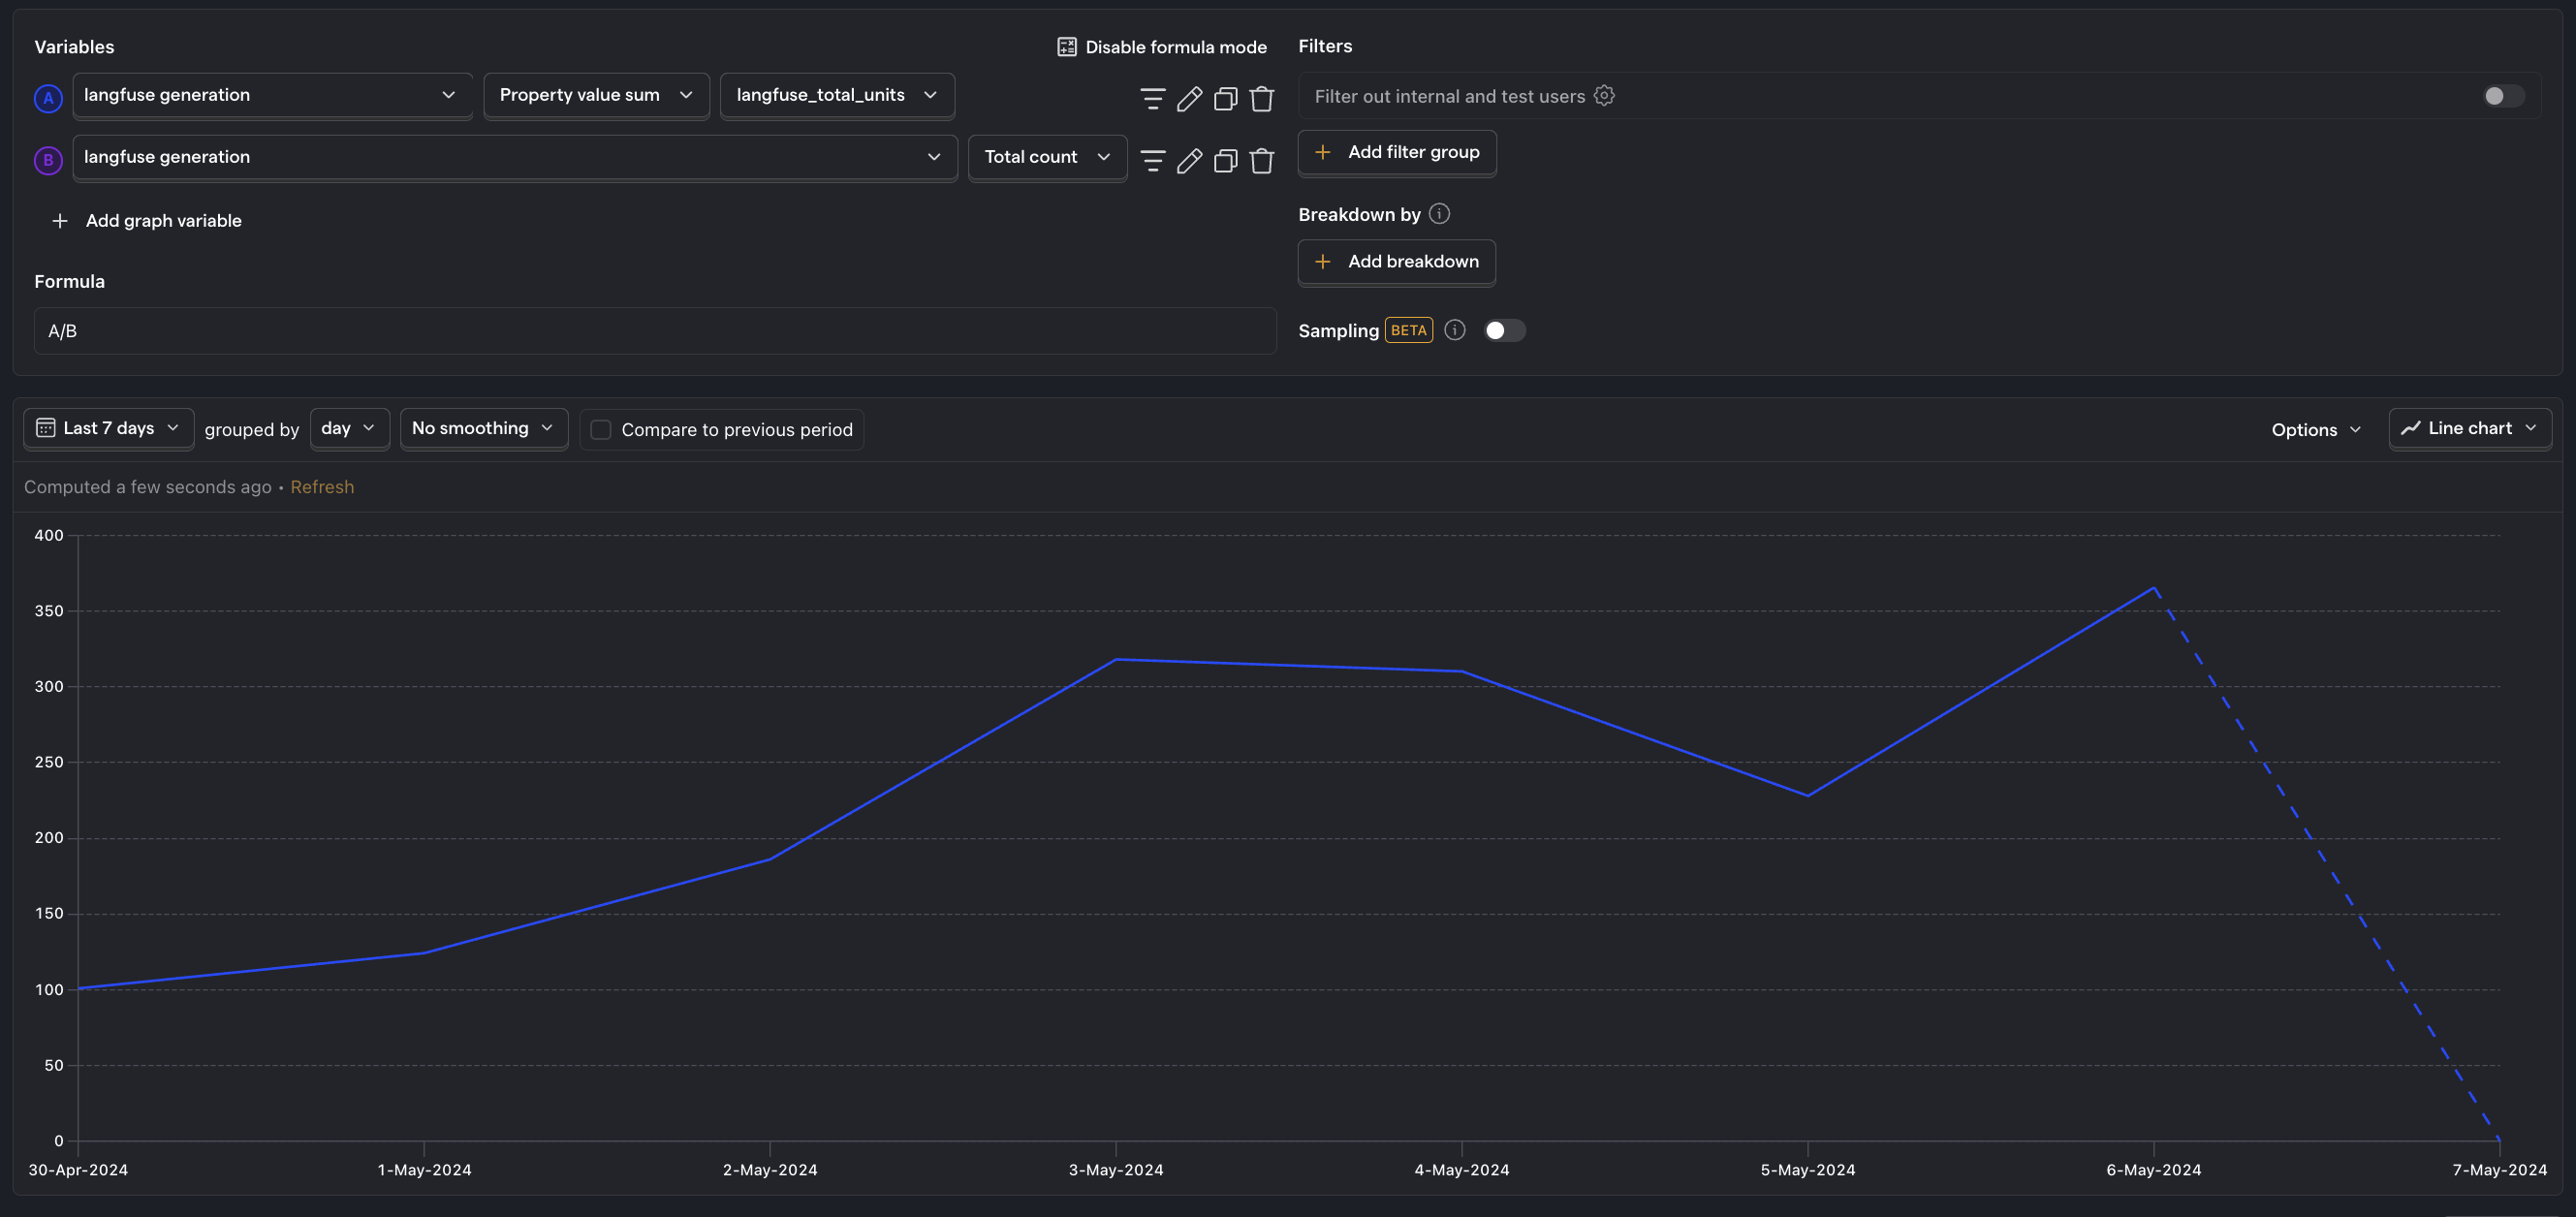
P95 cost per user
What is it? The top 5% of users who are consuming the most LLM costs.
Why it's useful: Determines if specific users disproportionately affect overall costs. You can then investigate whether these costs are justified by their usage, or if there are inefficiencies to address.
Questions to ask:
- What common characteristics or usage patterns do the top 5% of users have?
- Are there specific feature interactions that result in higher costs for these users?
- Is the high cost associated with these users sustainable or do you need to consider pricing adjustments?
Average cost per interaction
What is it? The cost associated with each request to your LLM.
Why it's useful: Enables you to pinpoint exactly which interactions are the most expensive.
Questions to ask:
- How does this number compare for each LLM model?
- Which specific requests are the most costly, and are there ways to reduce these costs?
- Are there noticeable spikes in cost per interaction, and what triggers them?
- Are interactions with the highest cost the ones that create the most value?
Usage metrics
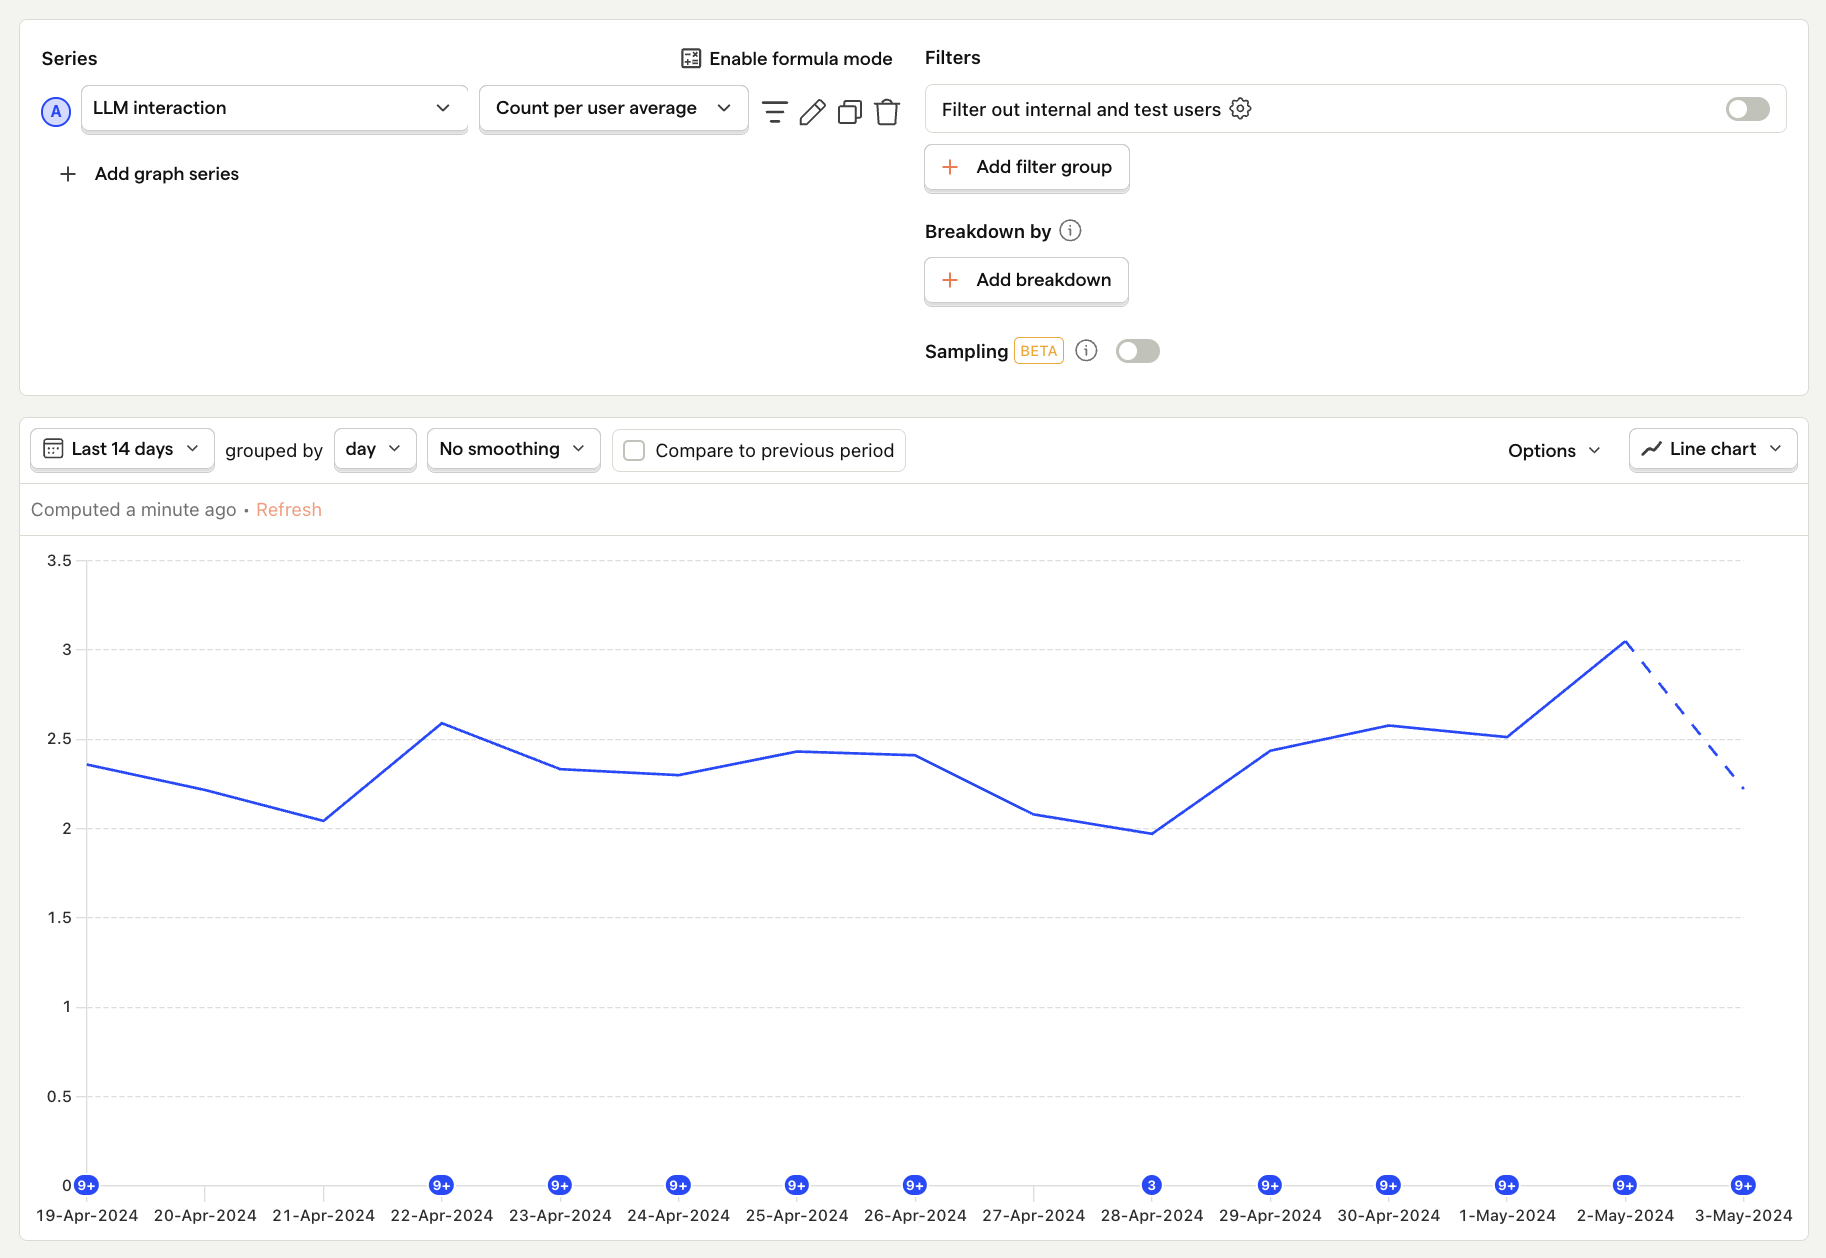
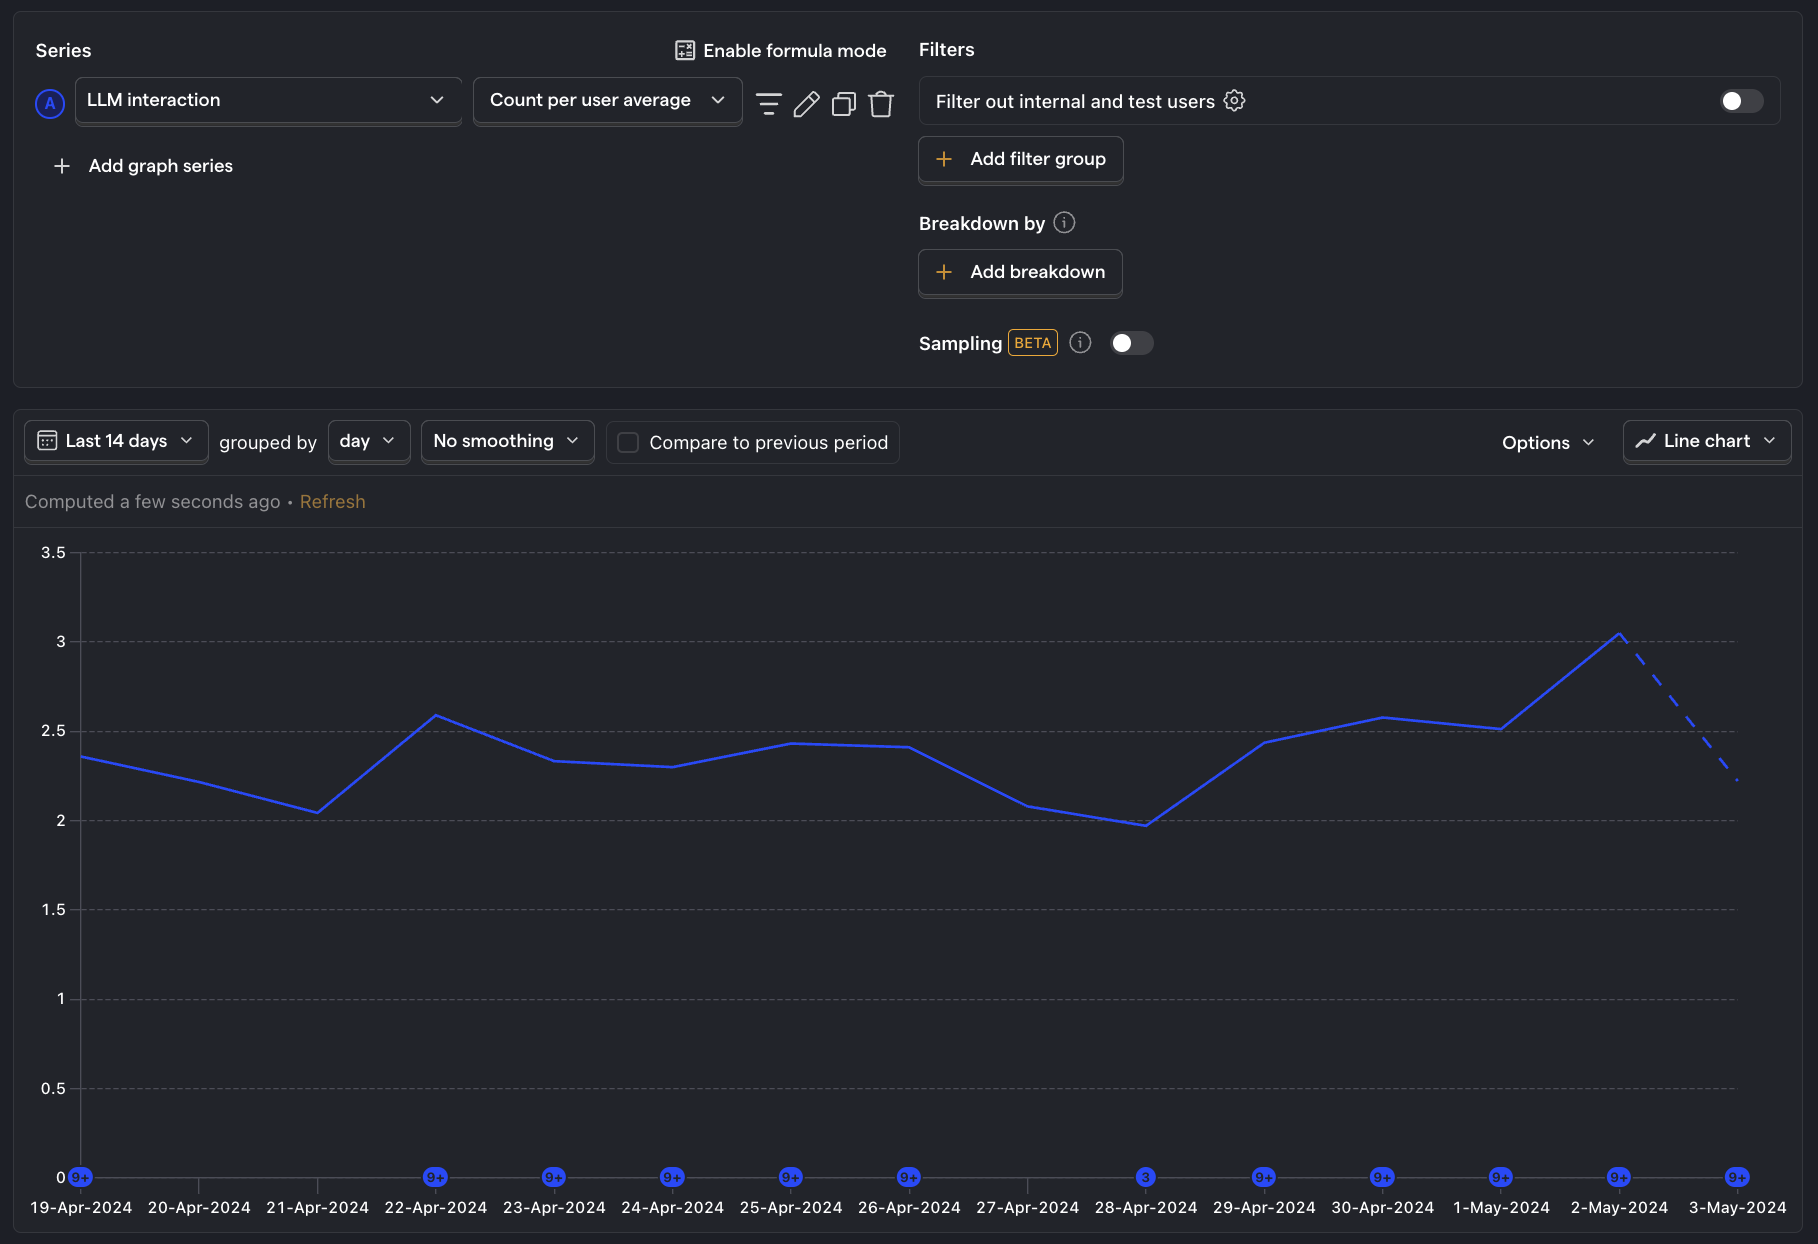
Average usage per user
What is it? How frequently the average user interacts with your LLM features.
Why it's useful: Indicates if your features provide value to your users if they are interacting with them multiple times per day.
Questions to ask
- How does usage vary among different cohorts or user personas?
- What are the most engaged users doing that the least engaged are not?
- Are there specific features that drive more interactions? Why?
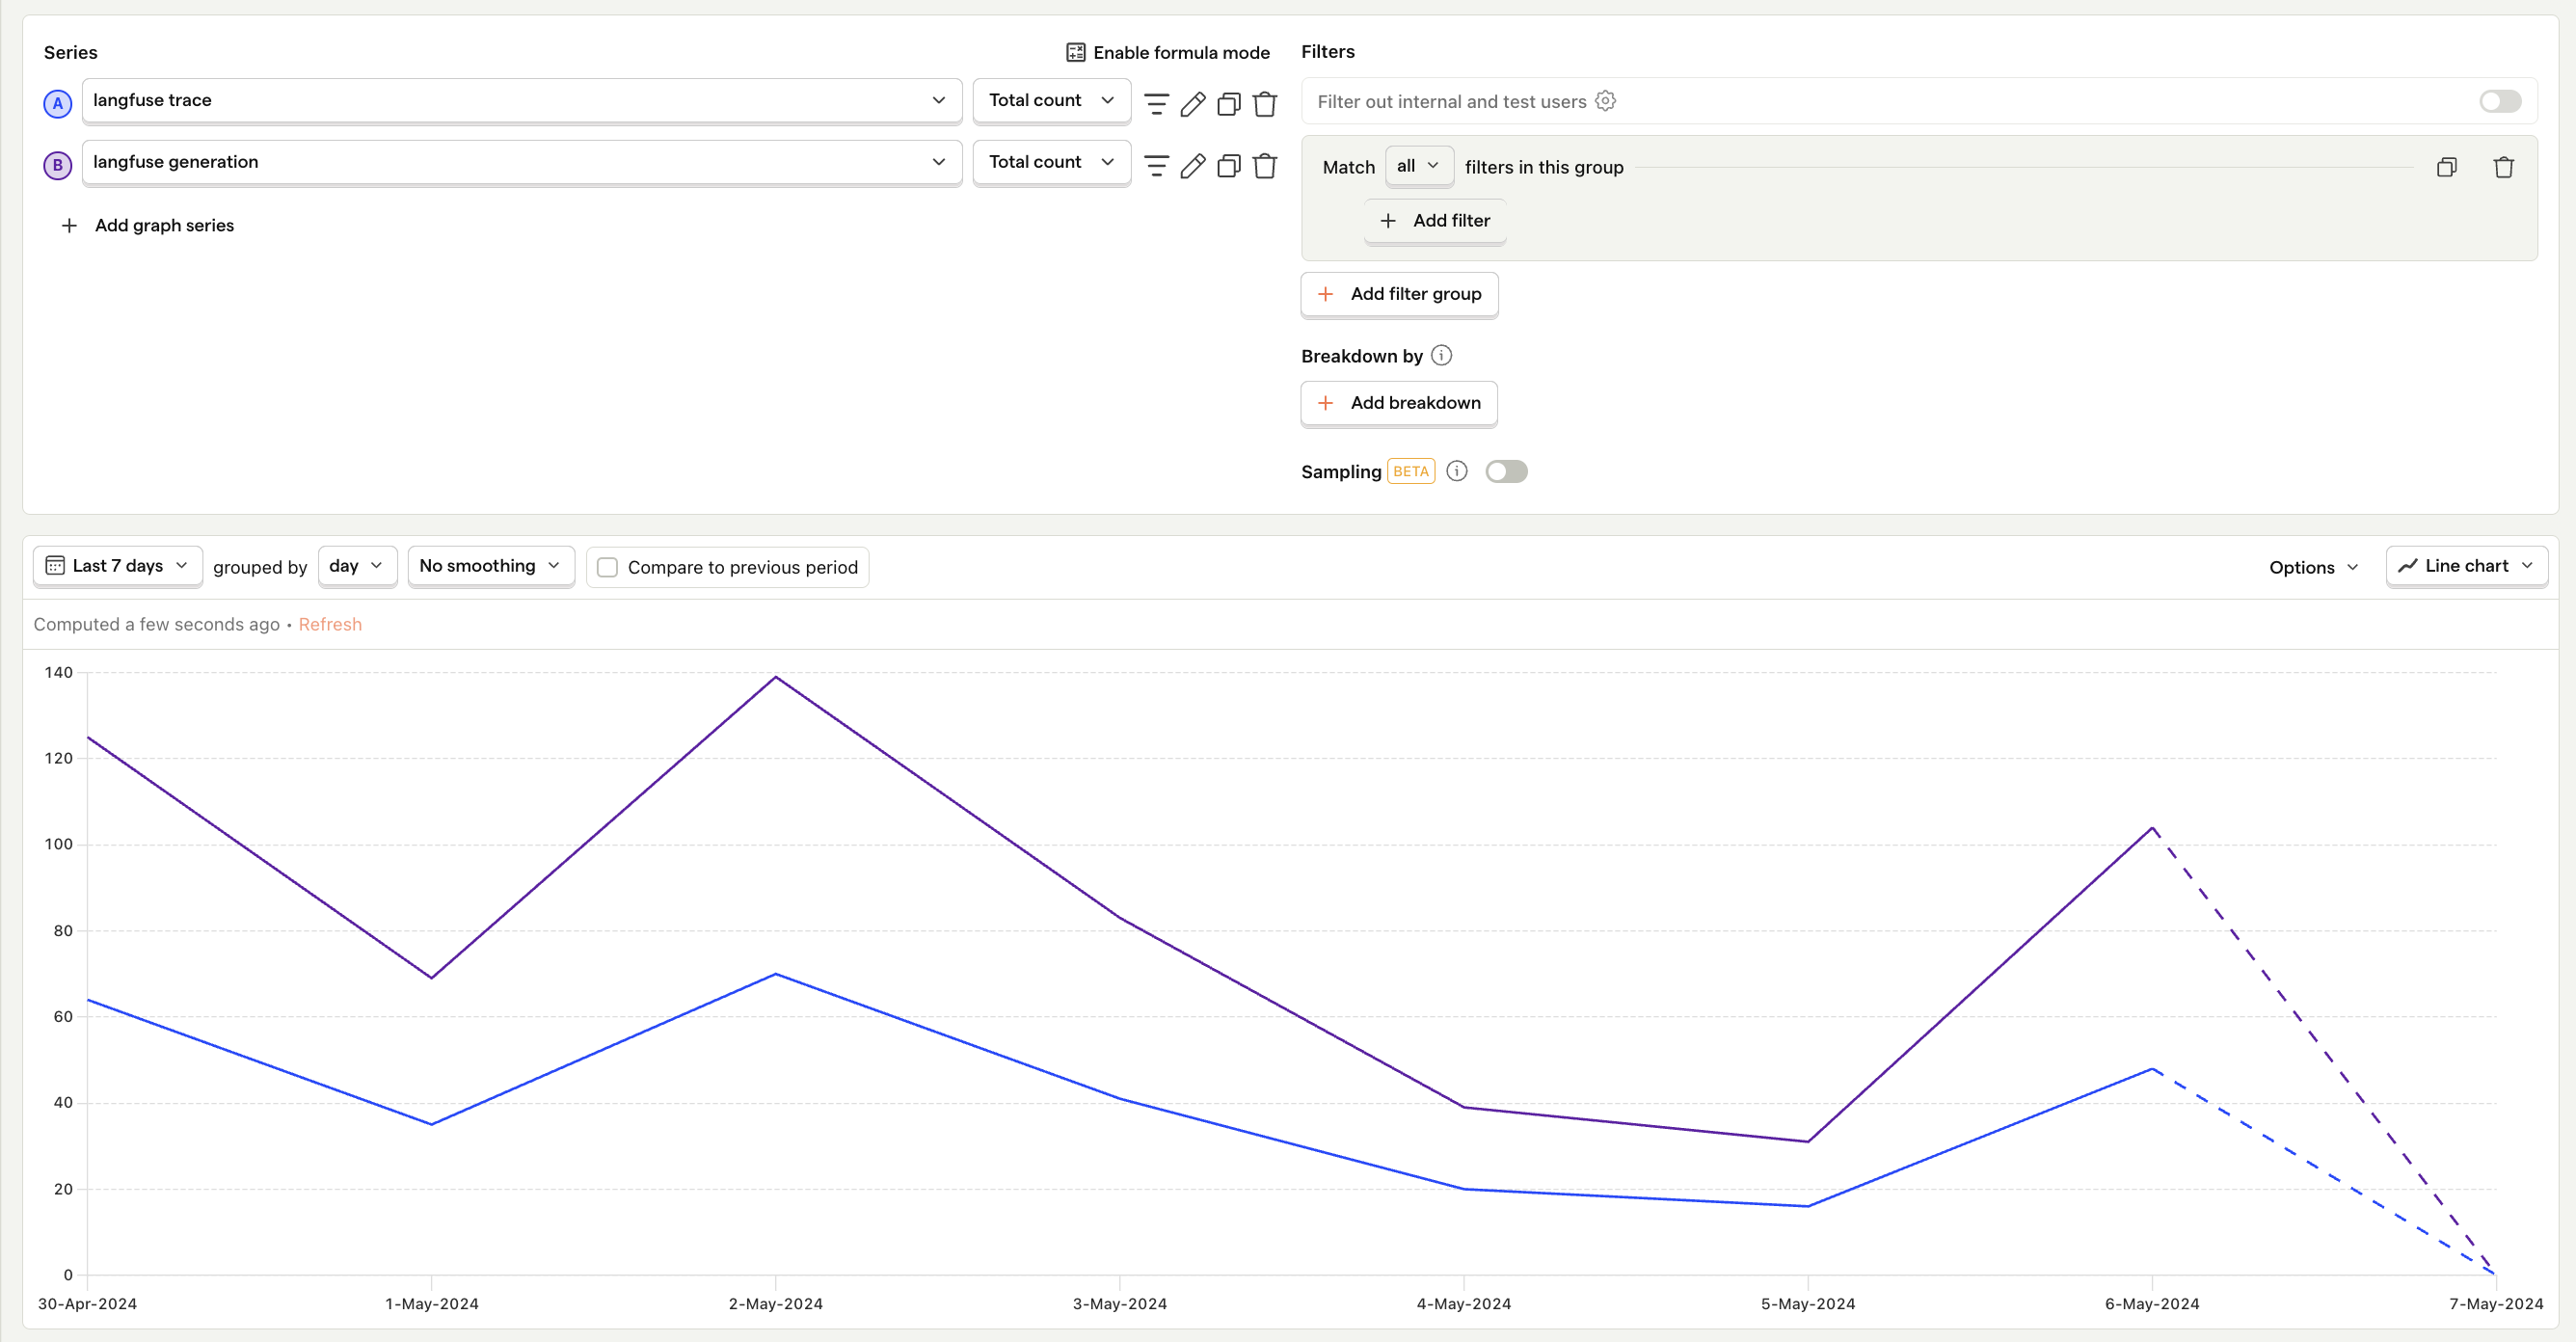
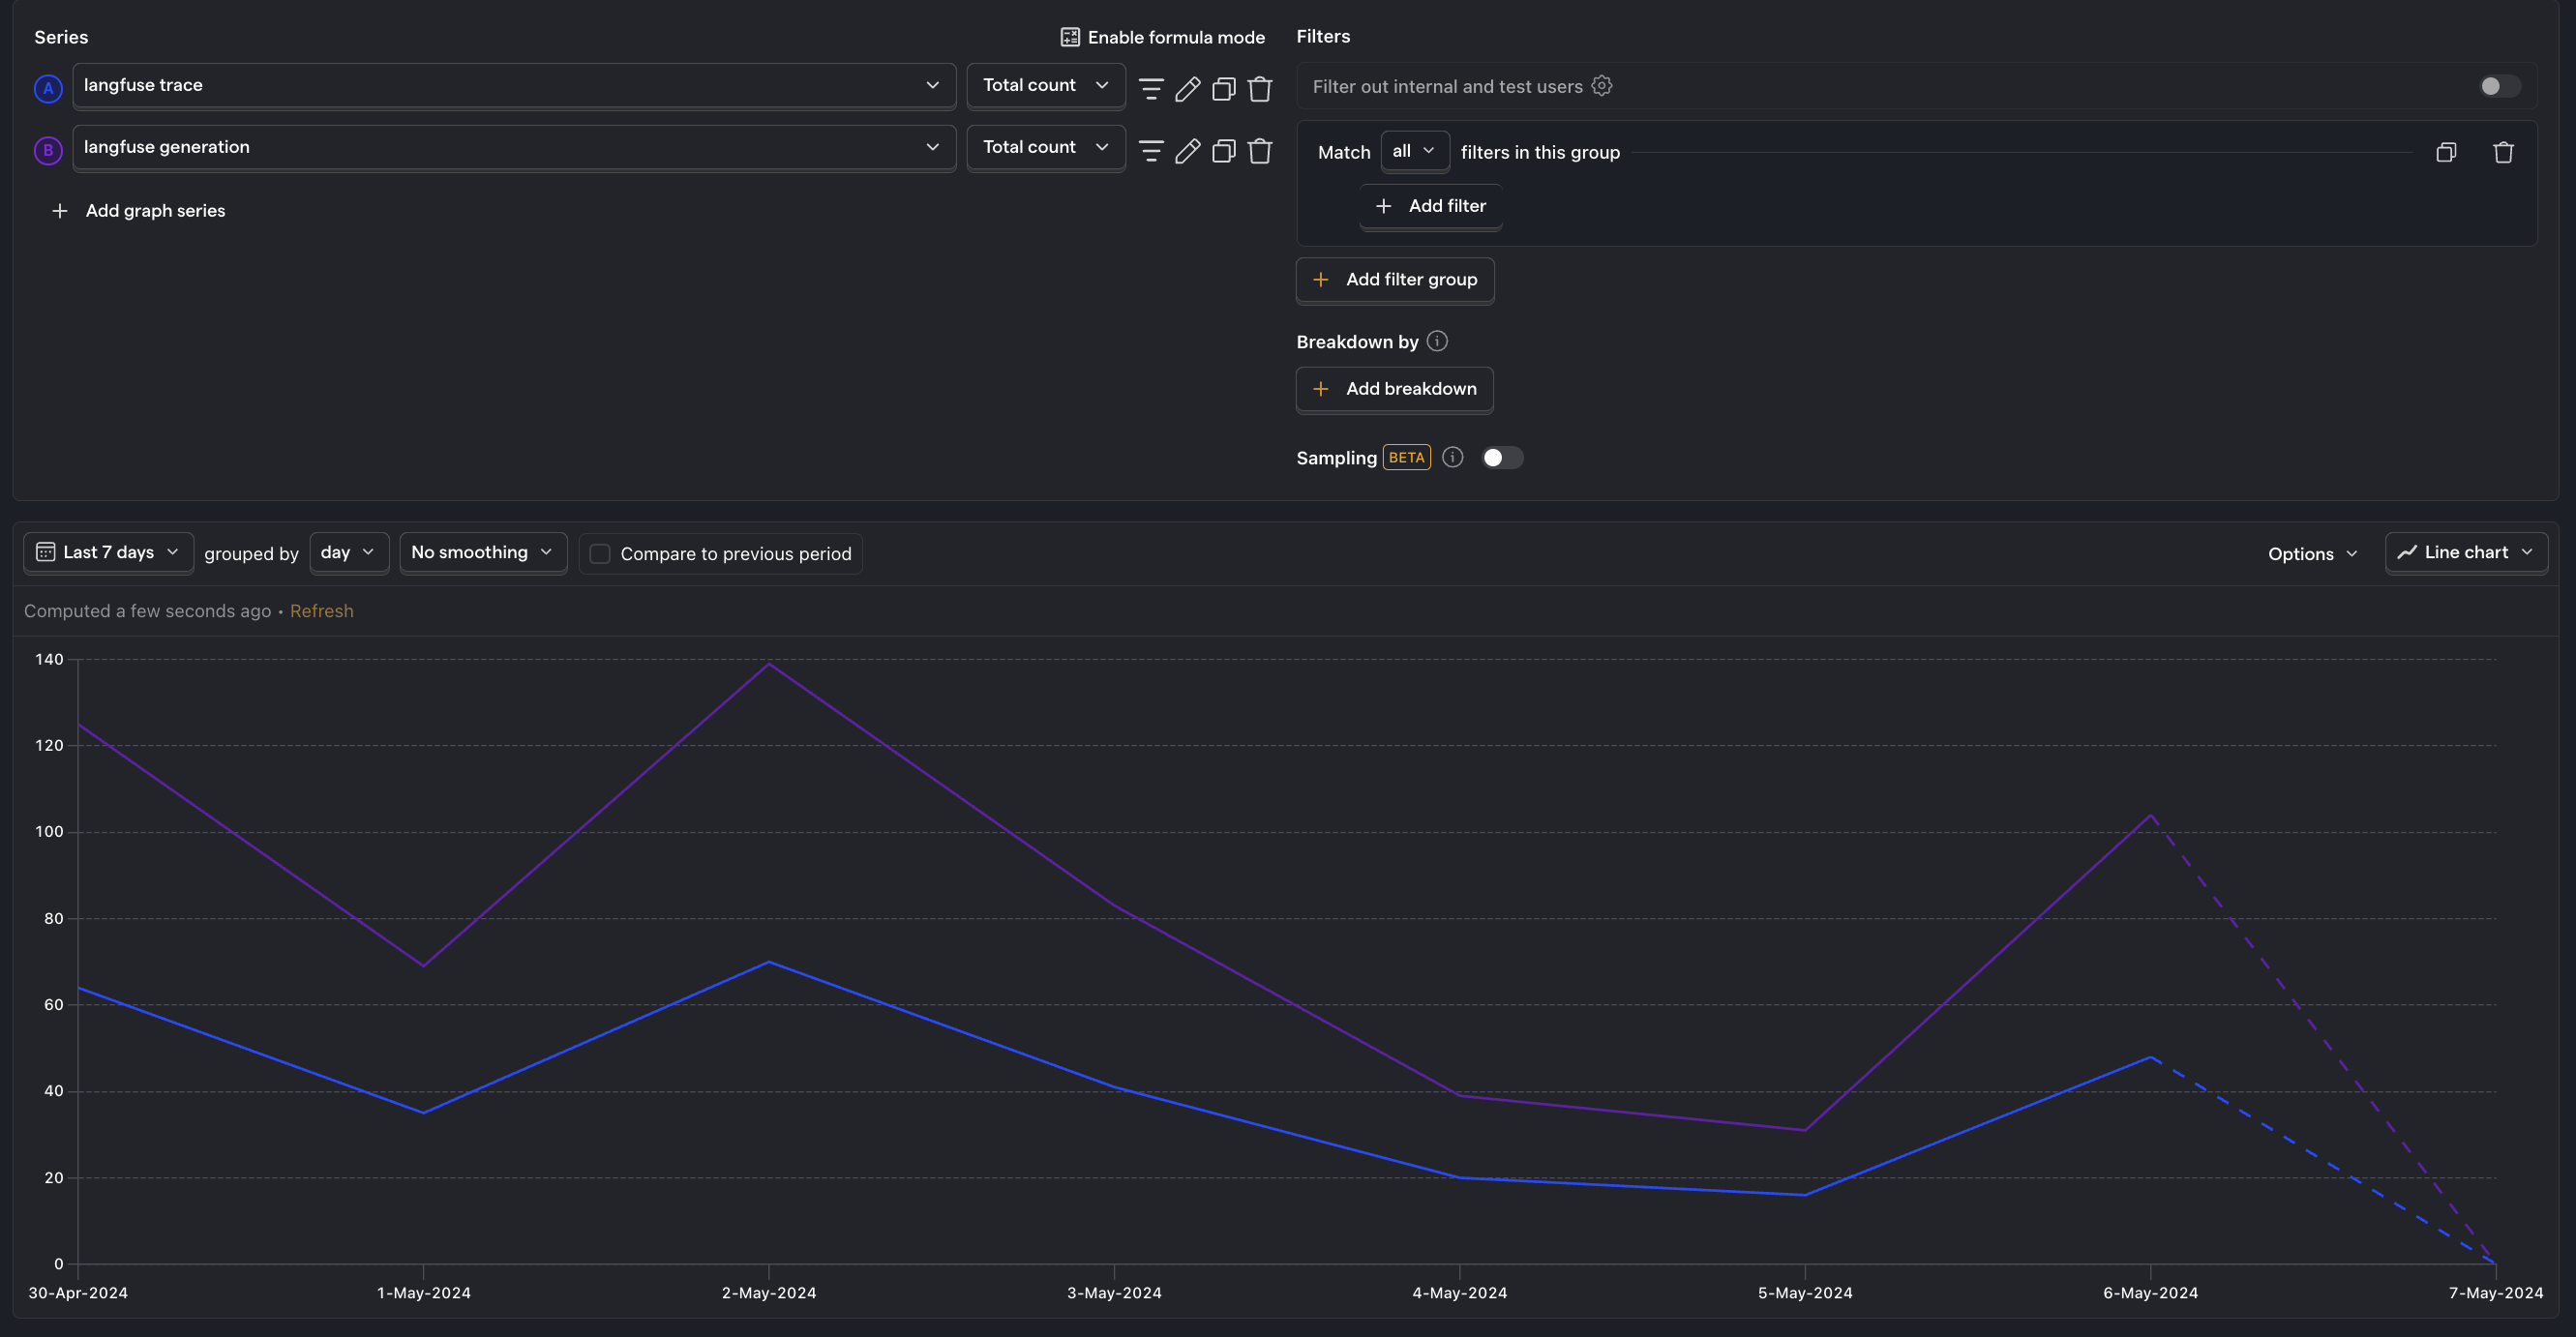
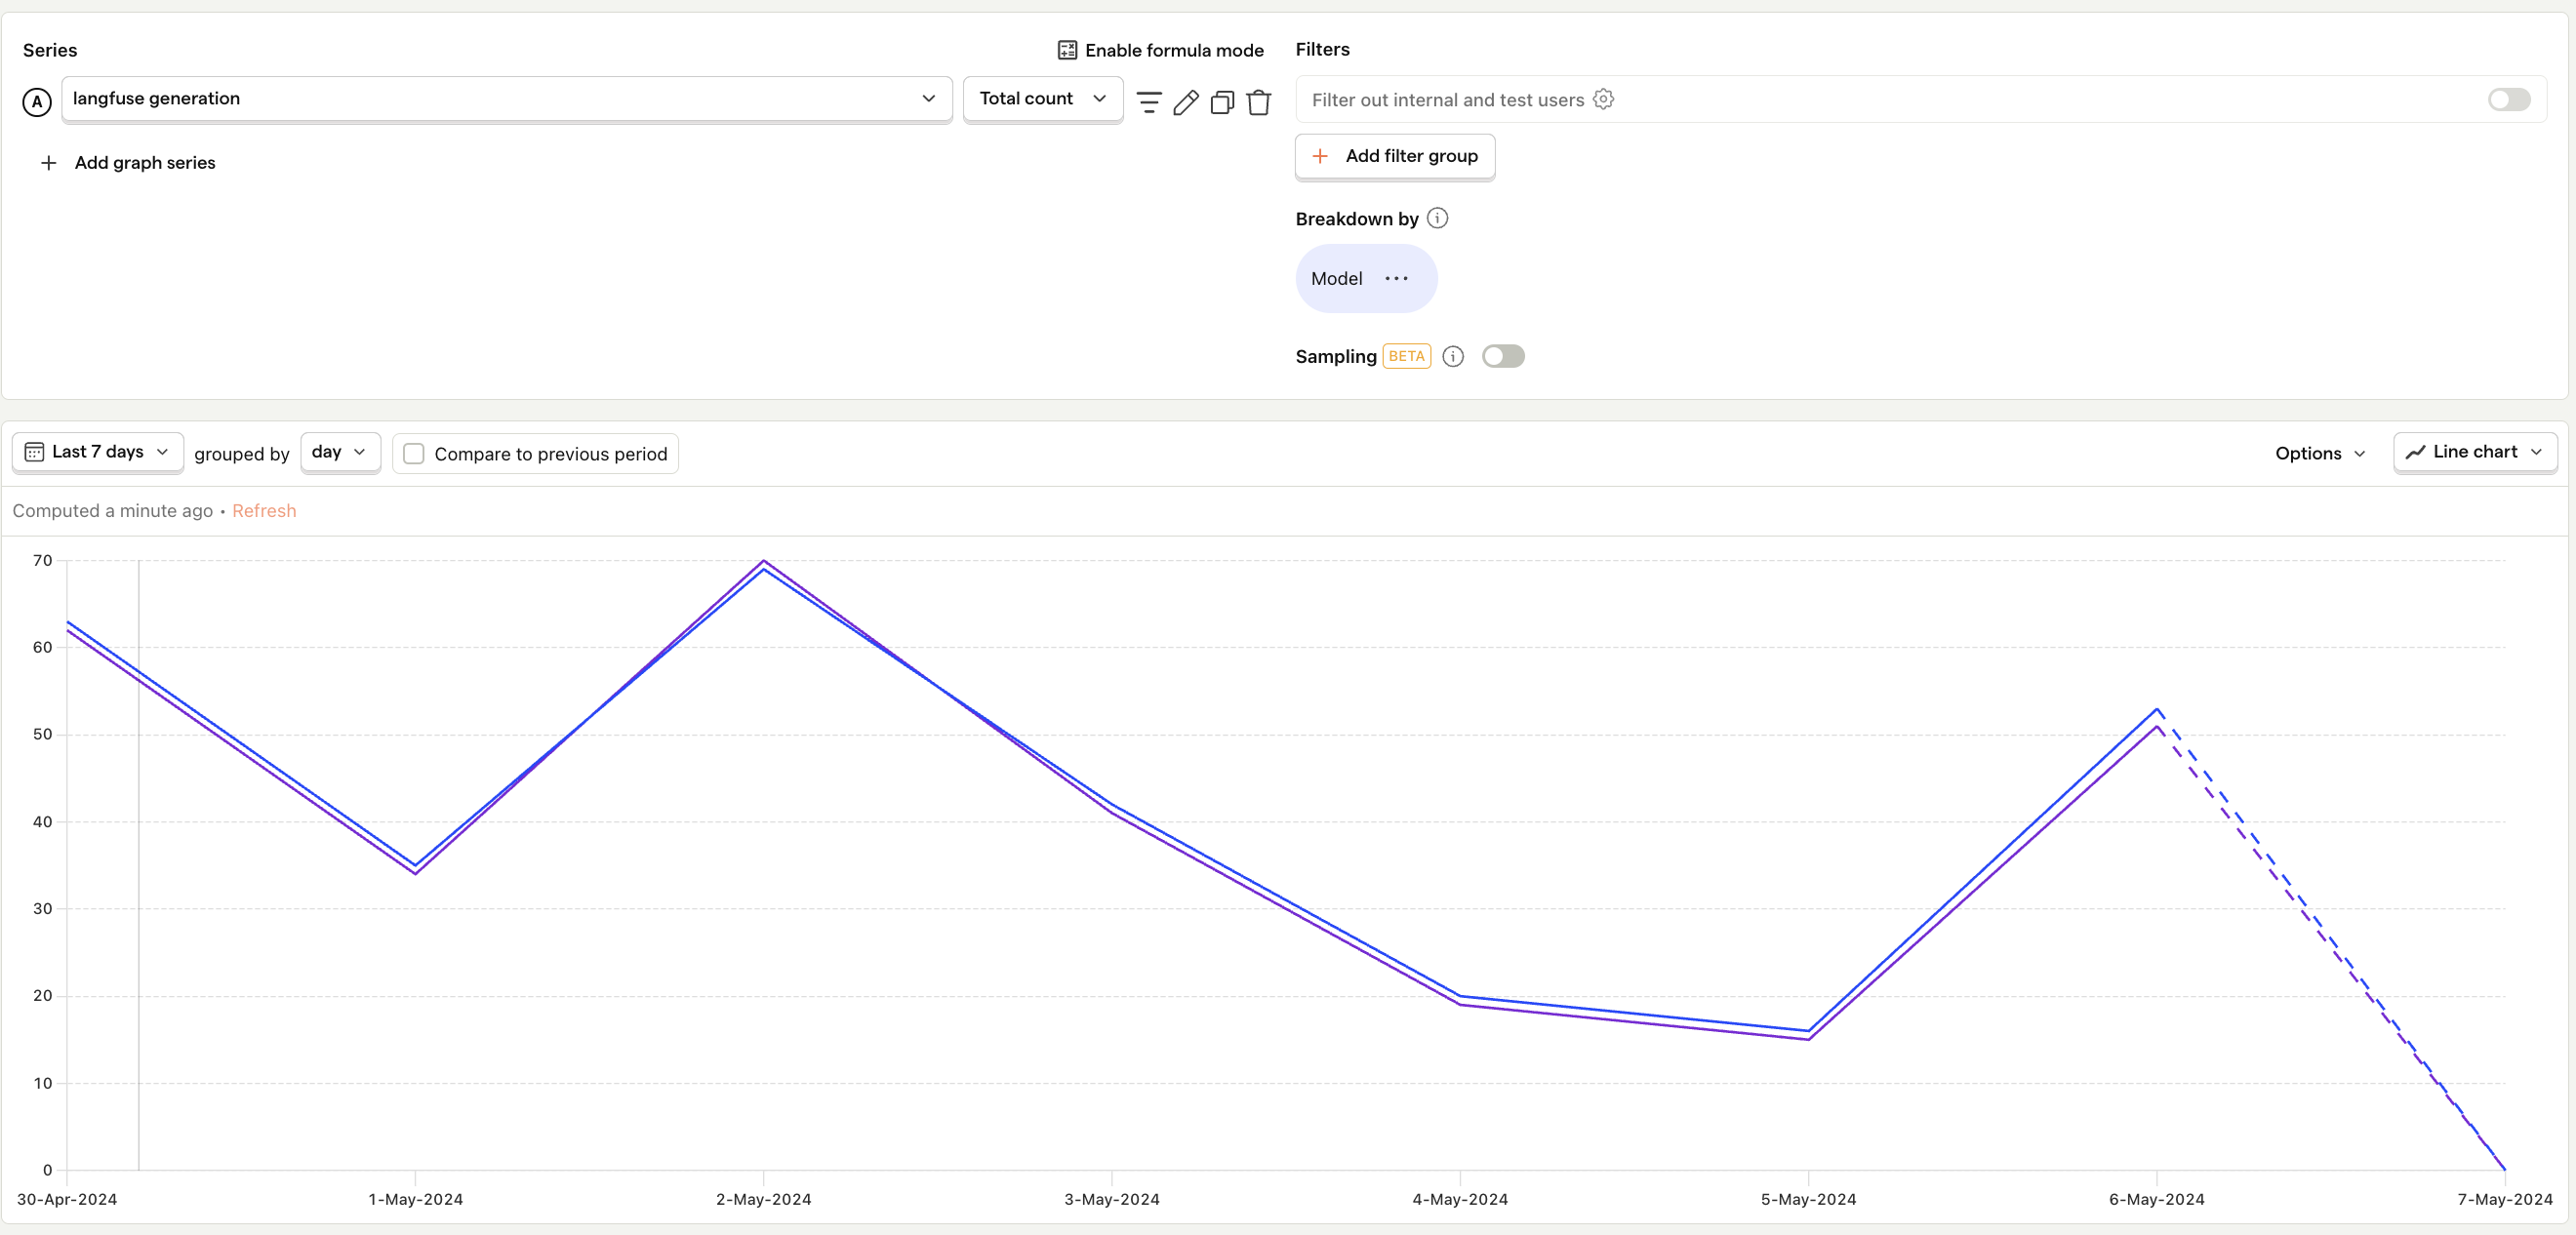
Generation count
What is it? The total number of outputs your LLM generates per day, week, or month.
Why it's useful: Helps assess the workload and demand placed on your LLMs, which directly impacts costs and performance.
Questions to ask
- How has the generation count changed over time, and does this correlate with user growth or engagement?
- Are there specific times of day or days of the week when generation counts spike?
- How do different app features contribute to the generation count?
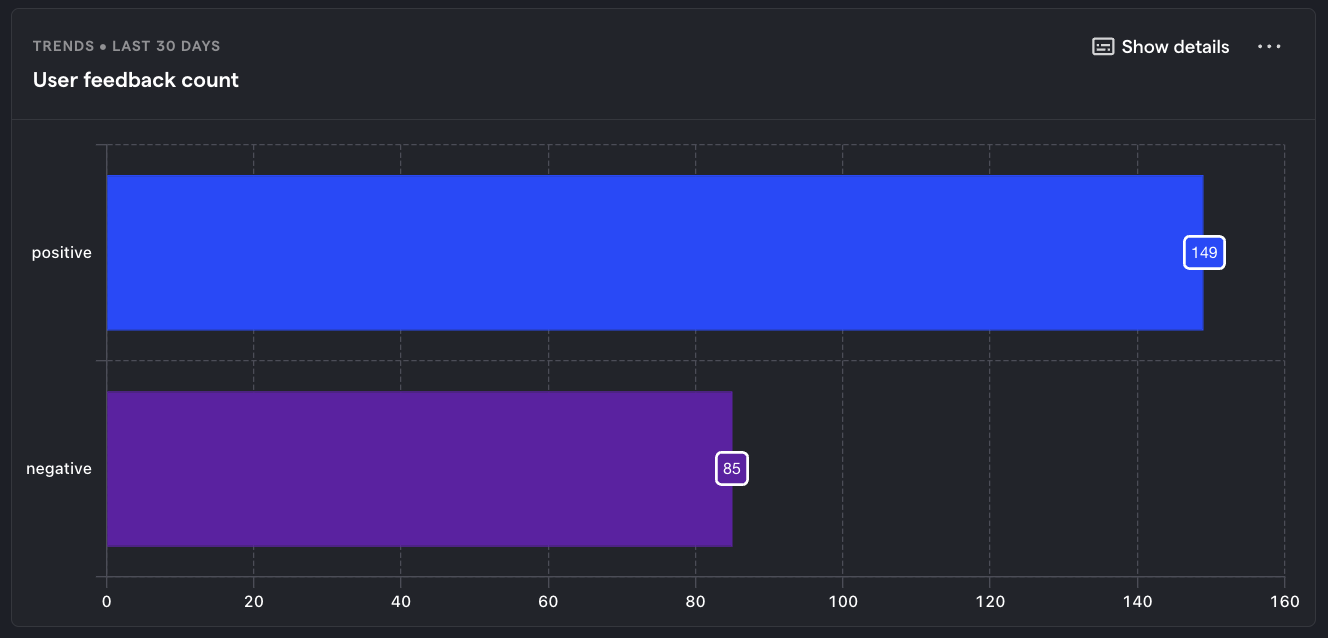
User feedback
What is it? The quality of the LLM's output, as rated by your users.
Why it's useful: Strongly correlated with important product-health metrics such as growth, churn, and NPS score.
Questions to ask
- Are there specific user segments that are more satisfied or dissatisfied with the LLM outputs?
- What are the specific input and output tokens of the best and worst scores?
- How likely are users to churn from your product following a bad LLM response?
Debug metrics
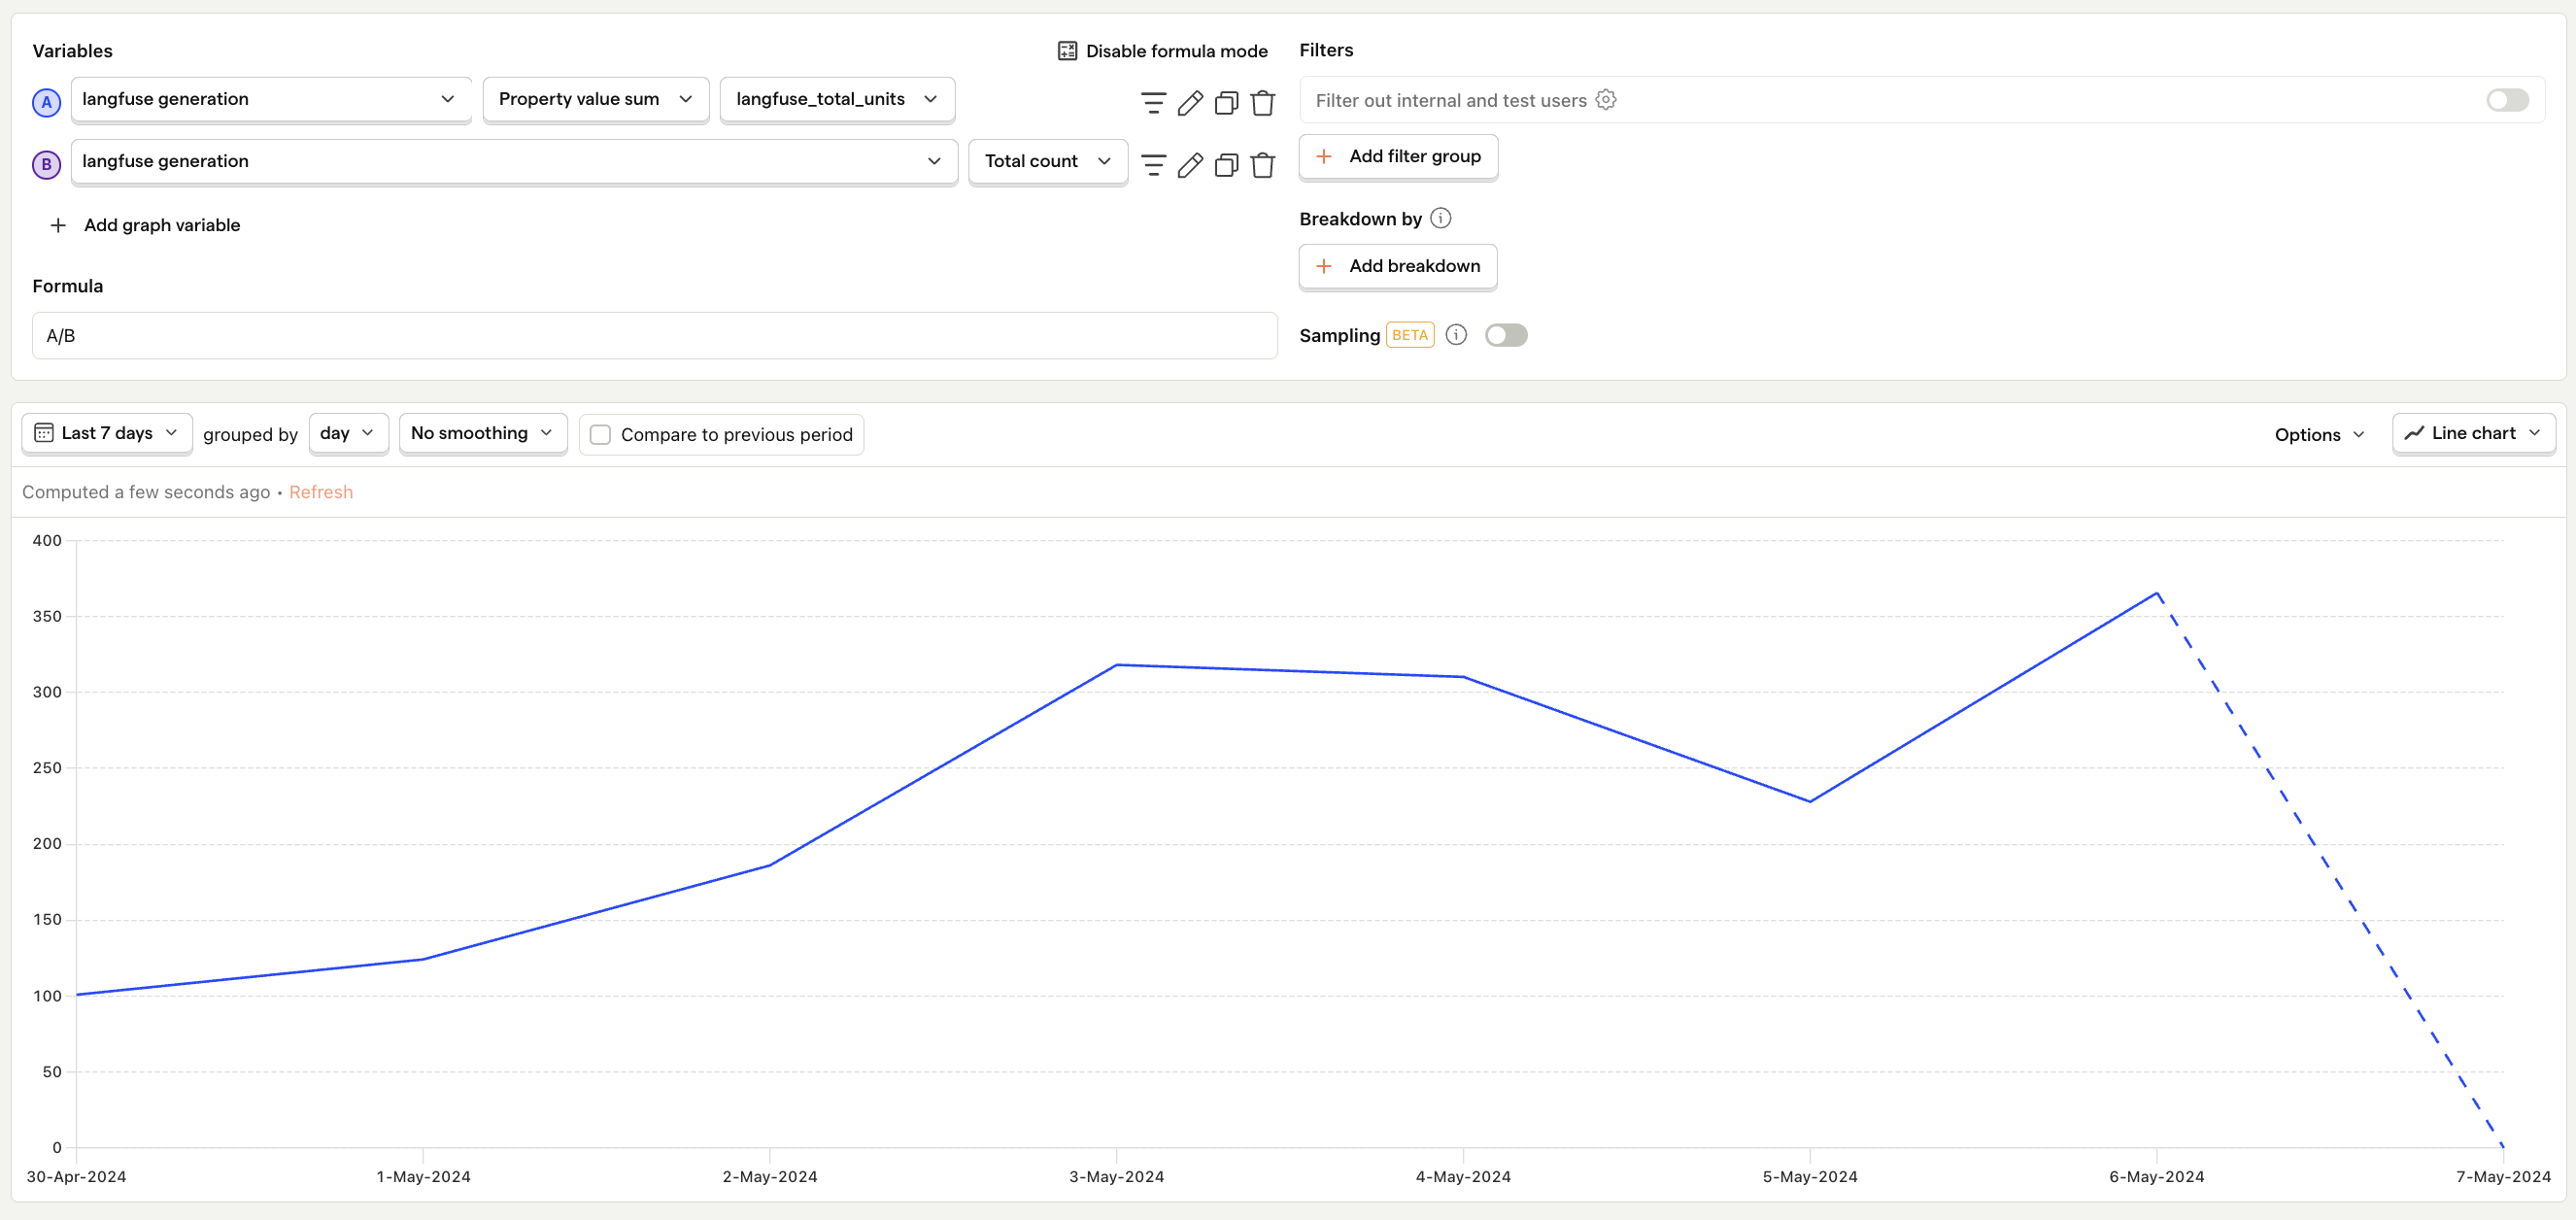
Average number of tokens per request
What is it? The sum of input and output tokens consumed in each request, also known as request size.
Why it's useful: Essential for optimizing performance and cost. Larger requests lead to higher costs and longer processing times, while smaller requests may lead to more frequent requests.
Questions to ask
- How has the average changed over time?
- Are there specific features or types of interactions that typically involve larger or smaller requests?
- How do variations in request size impact the latency and costs of responses?
- Which requests can be made more efficient?
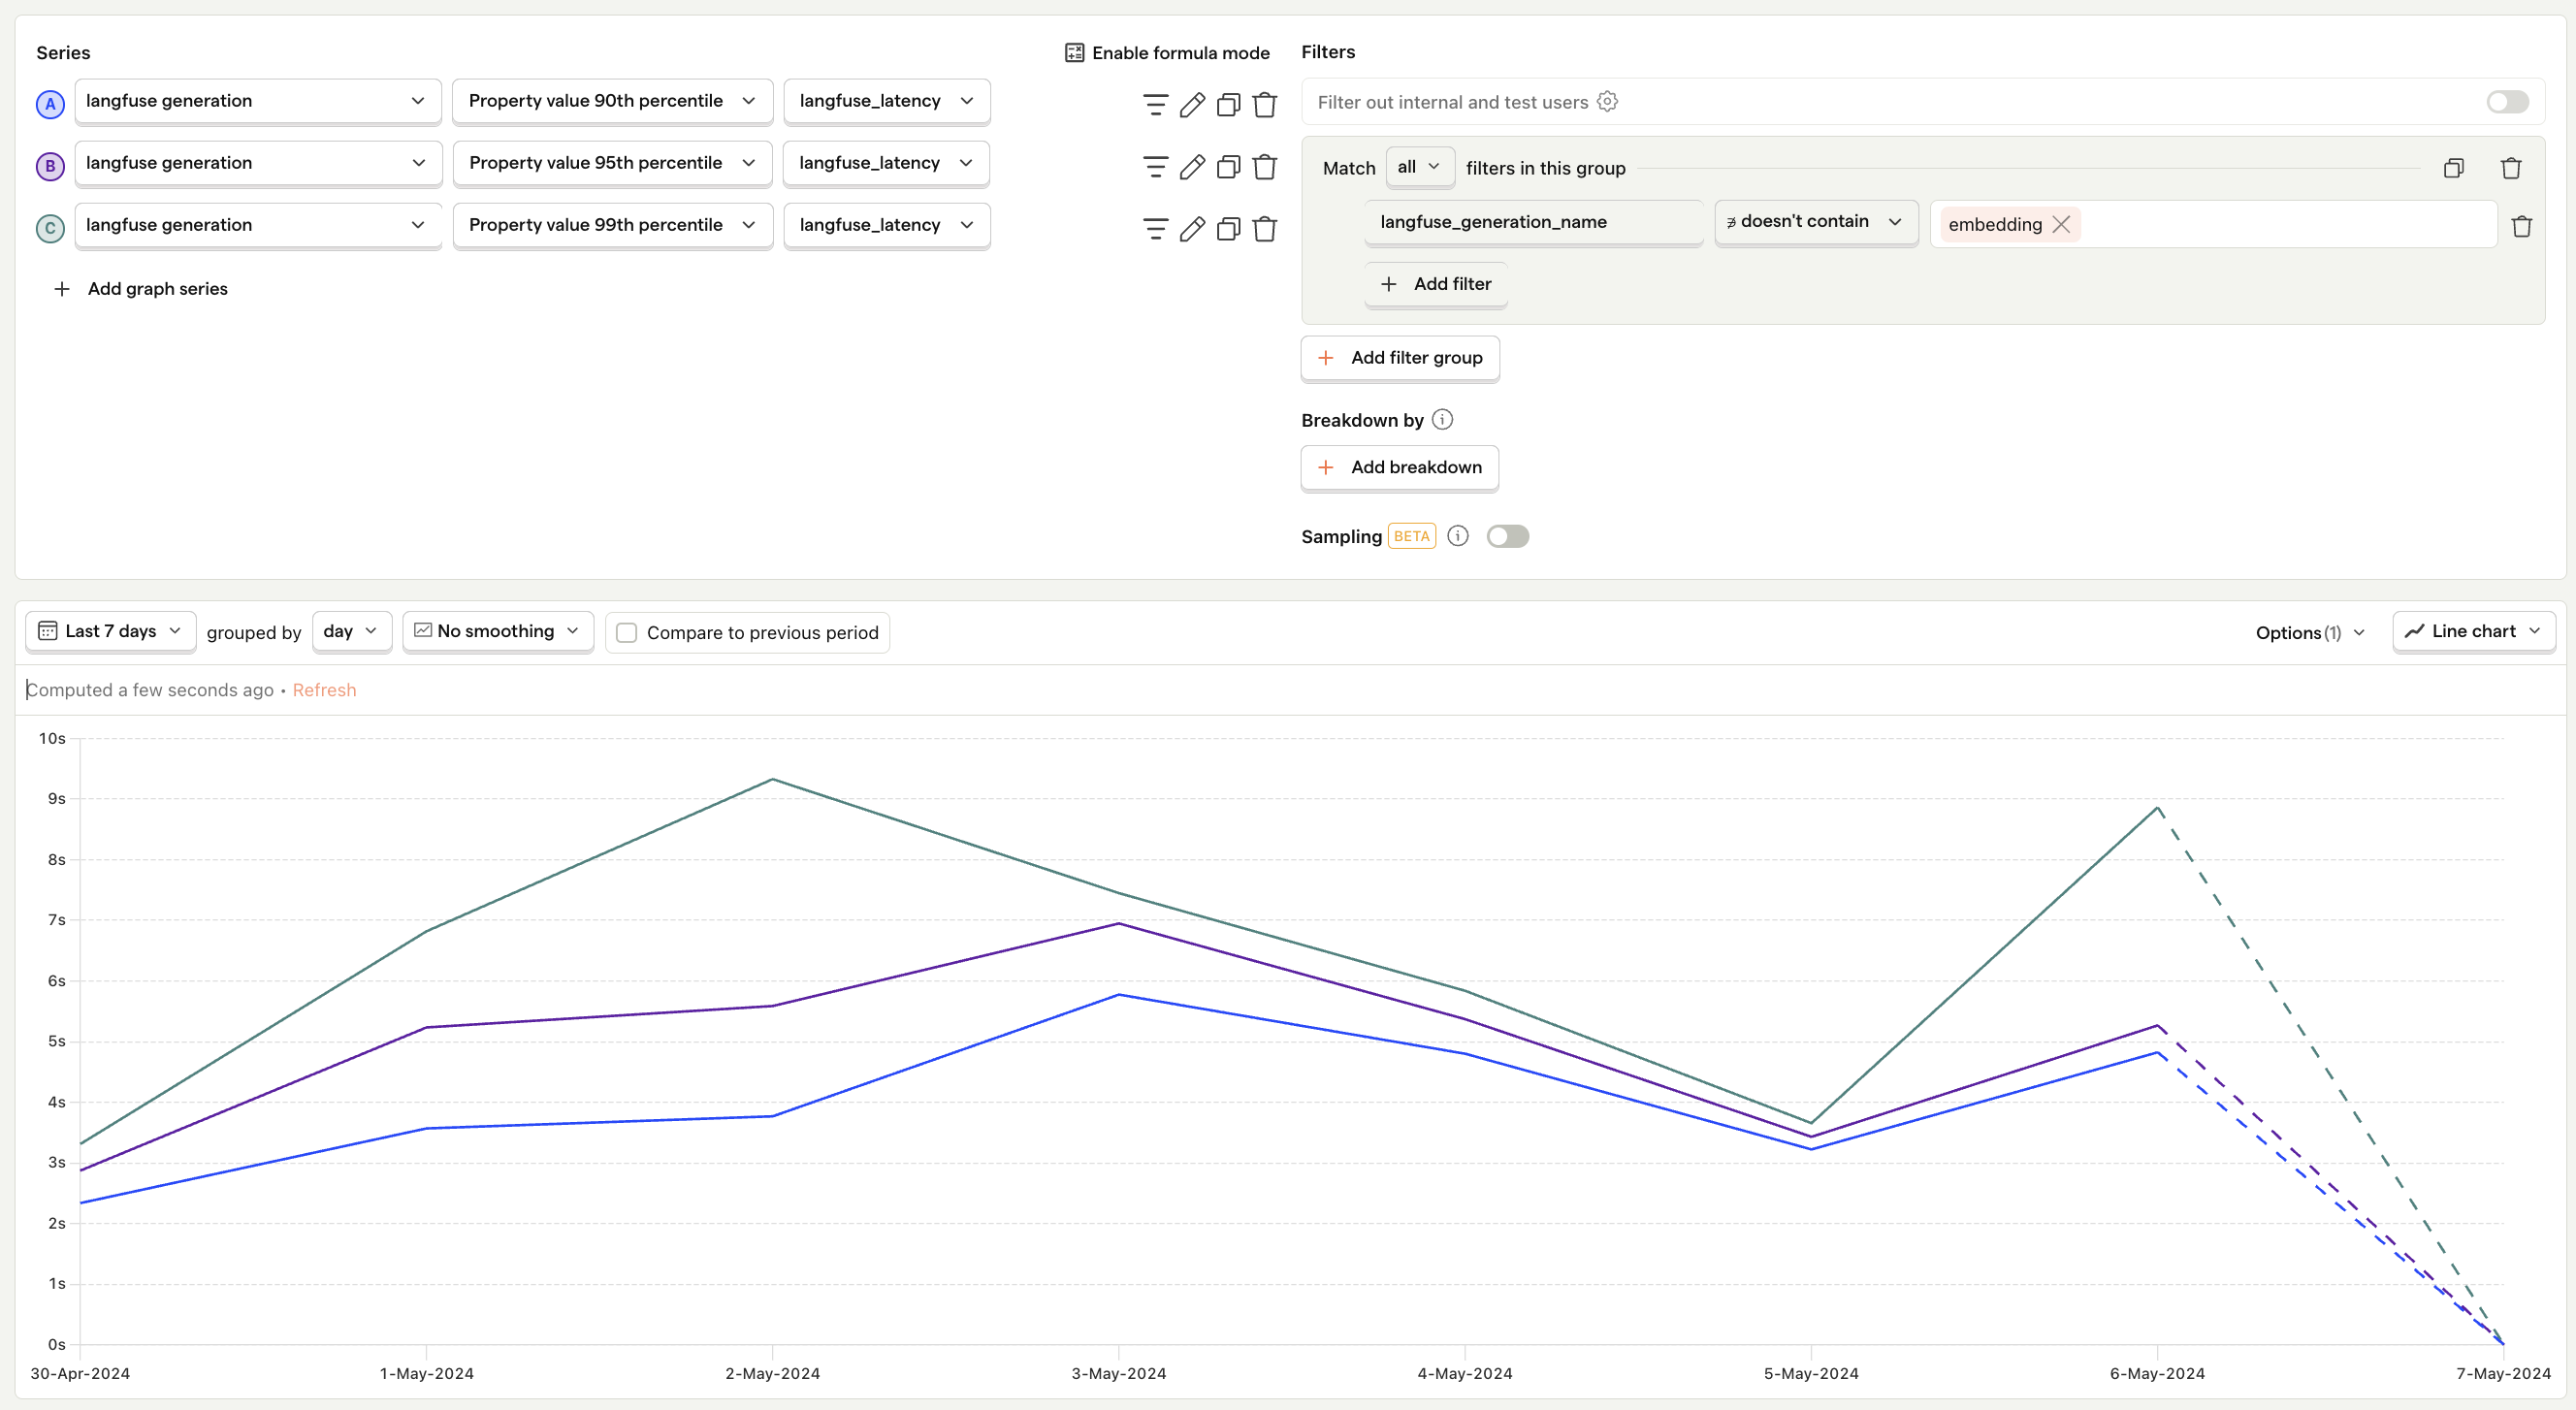
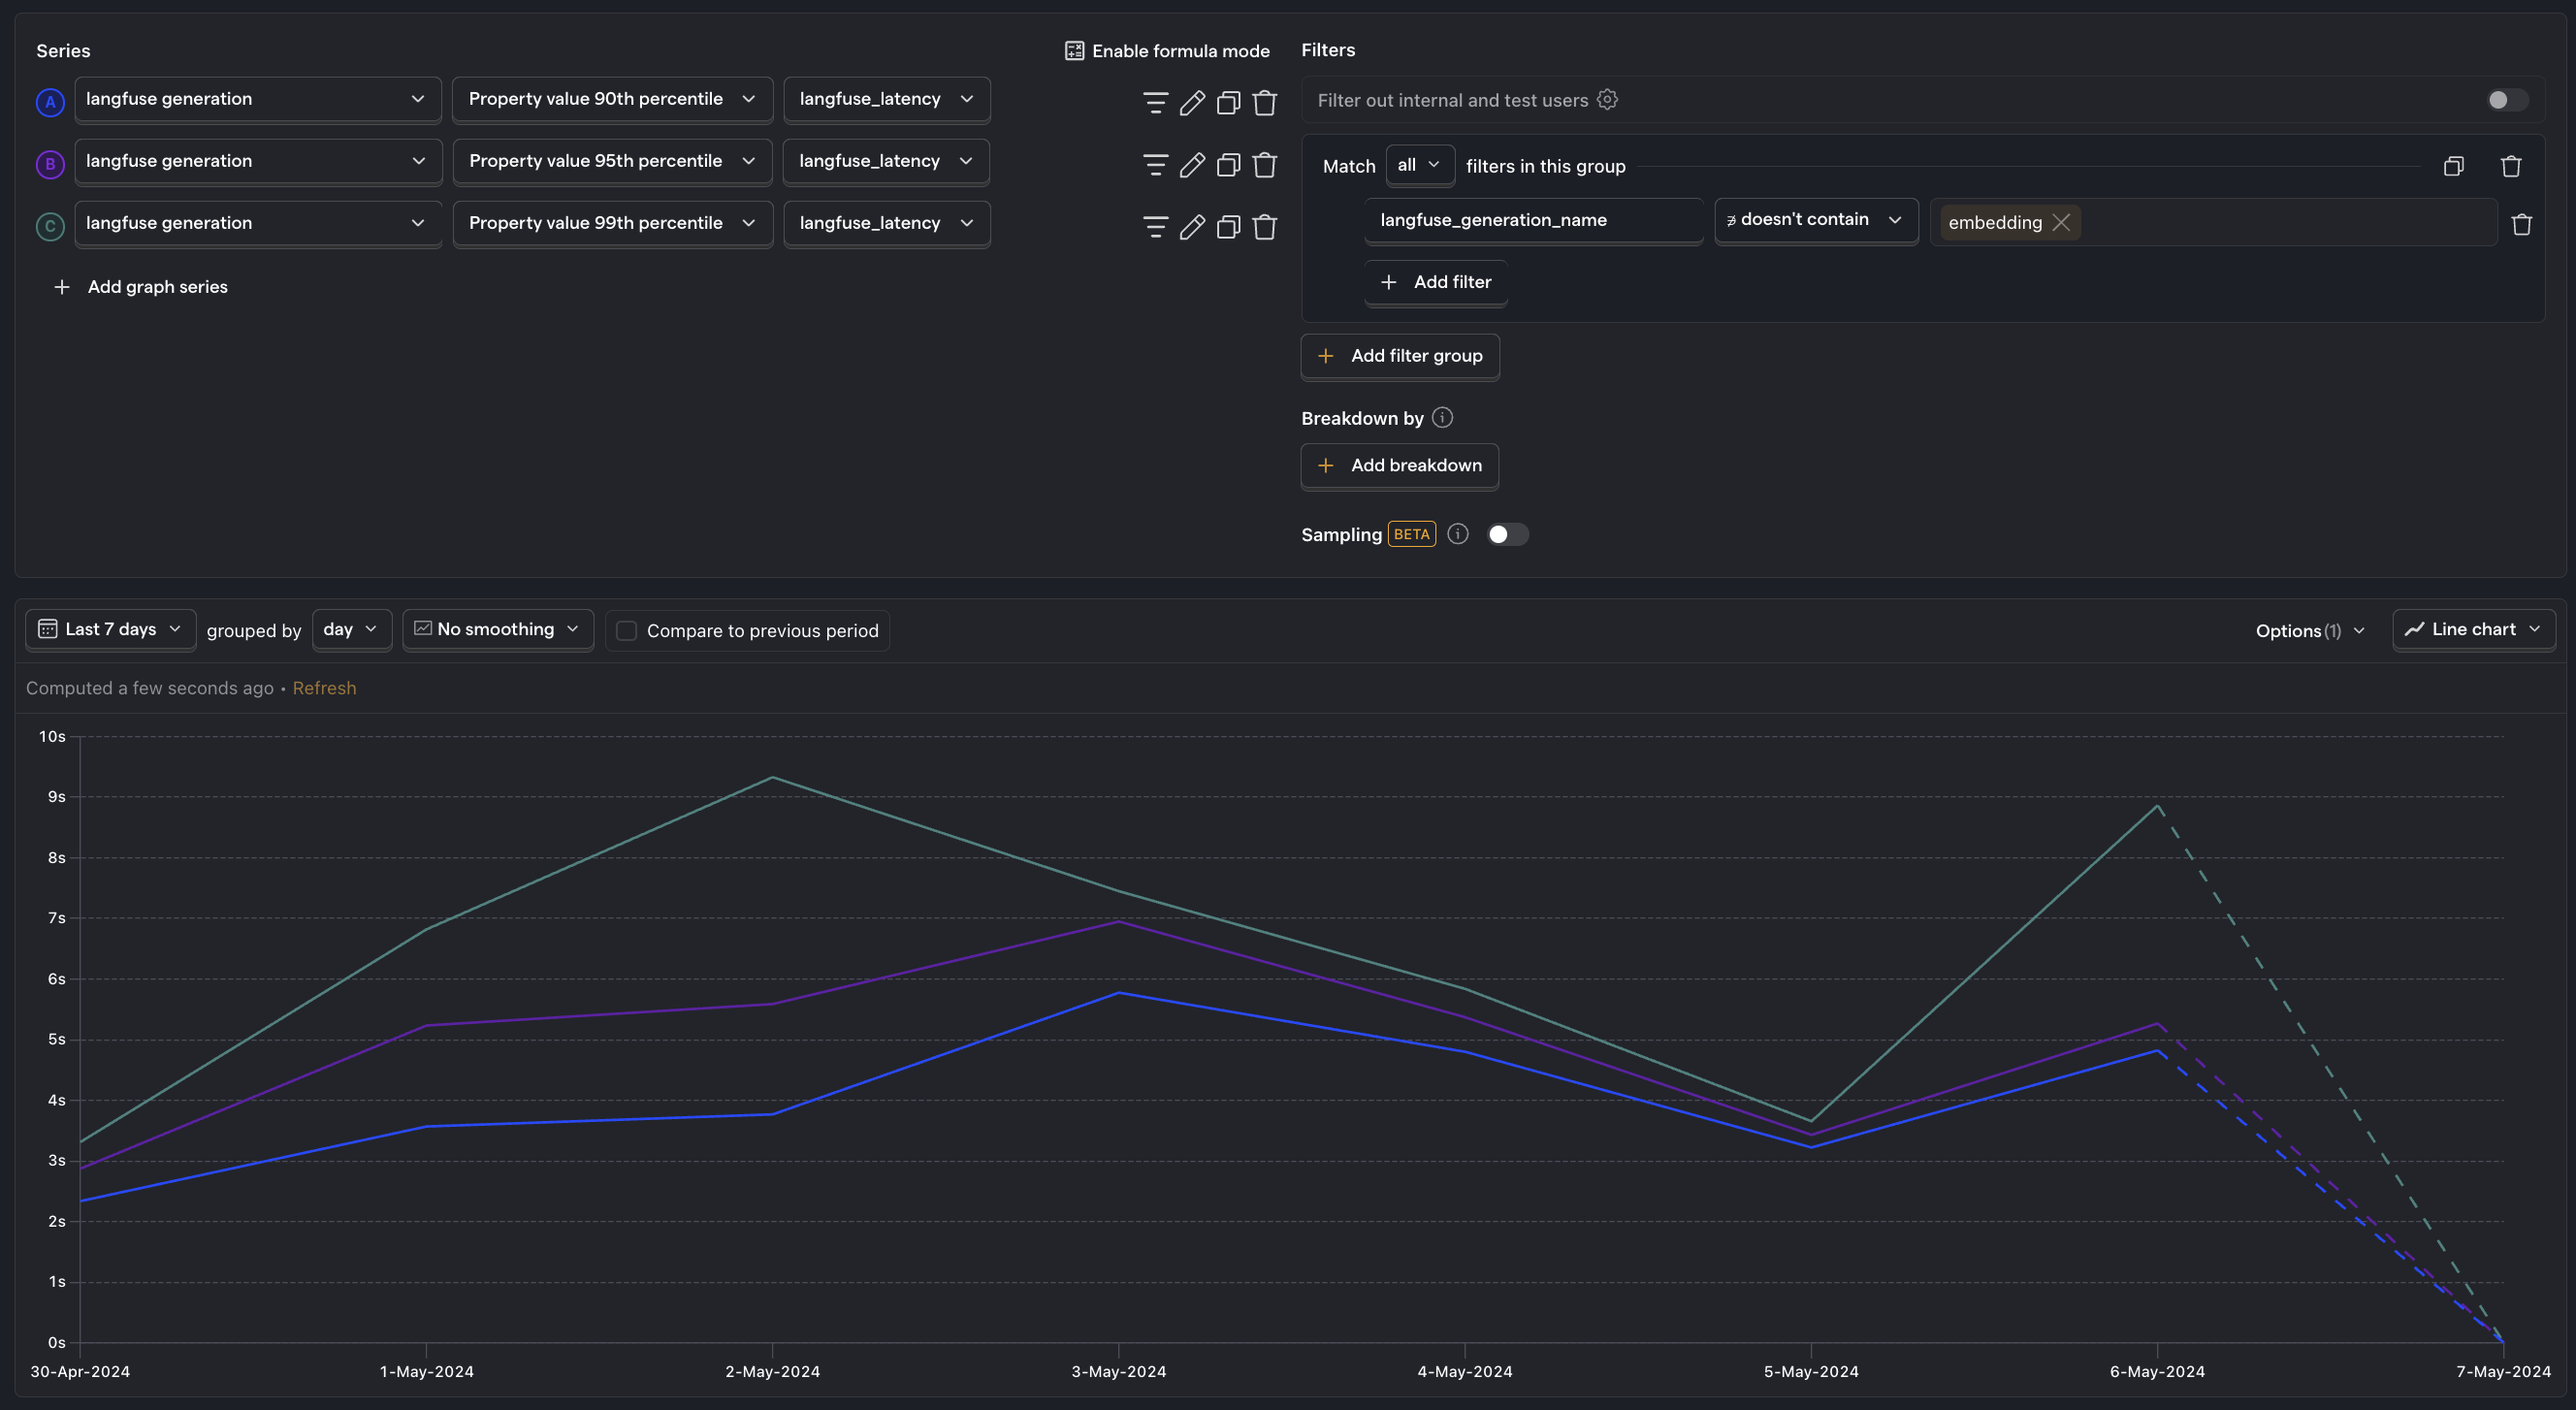
Generation latency
What is it? The time it takes for the LLM to generate a response.
Why it's useful: Helps identify performance bottlenecks and ensures your UX meets user expectations for speed.
Questions to ask
- Are there specific types of requests that have higher latency, and what can be done to address them?
- Are there latency spikes, and what causes them?
- How does latency correlate with user satisfaction and retention rates?
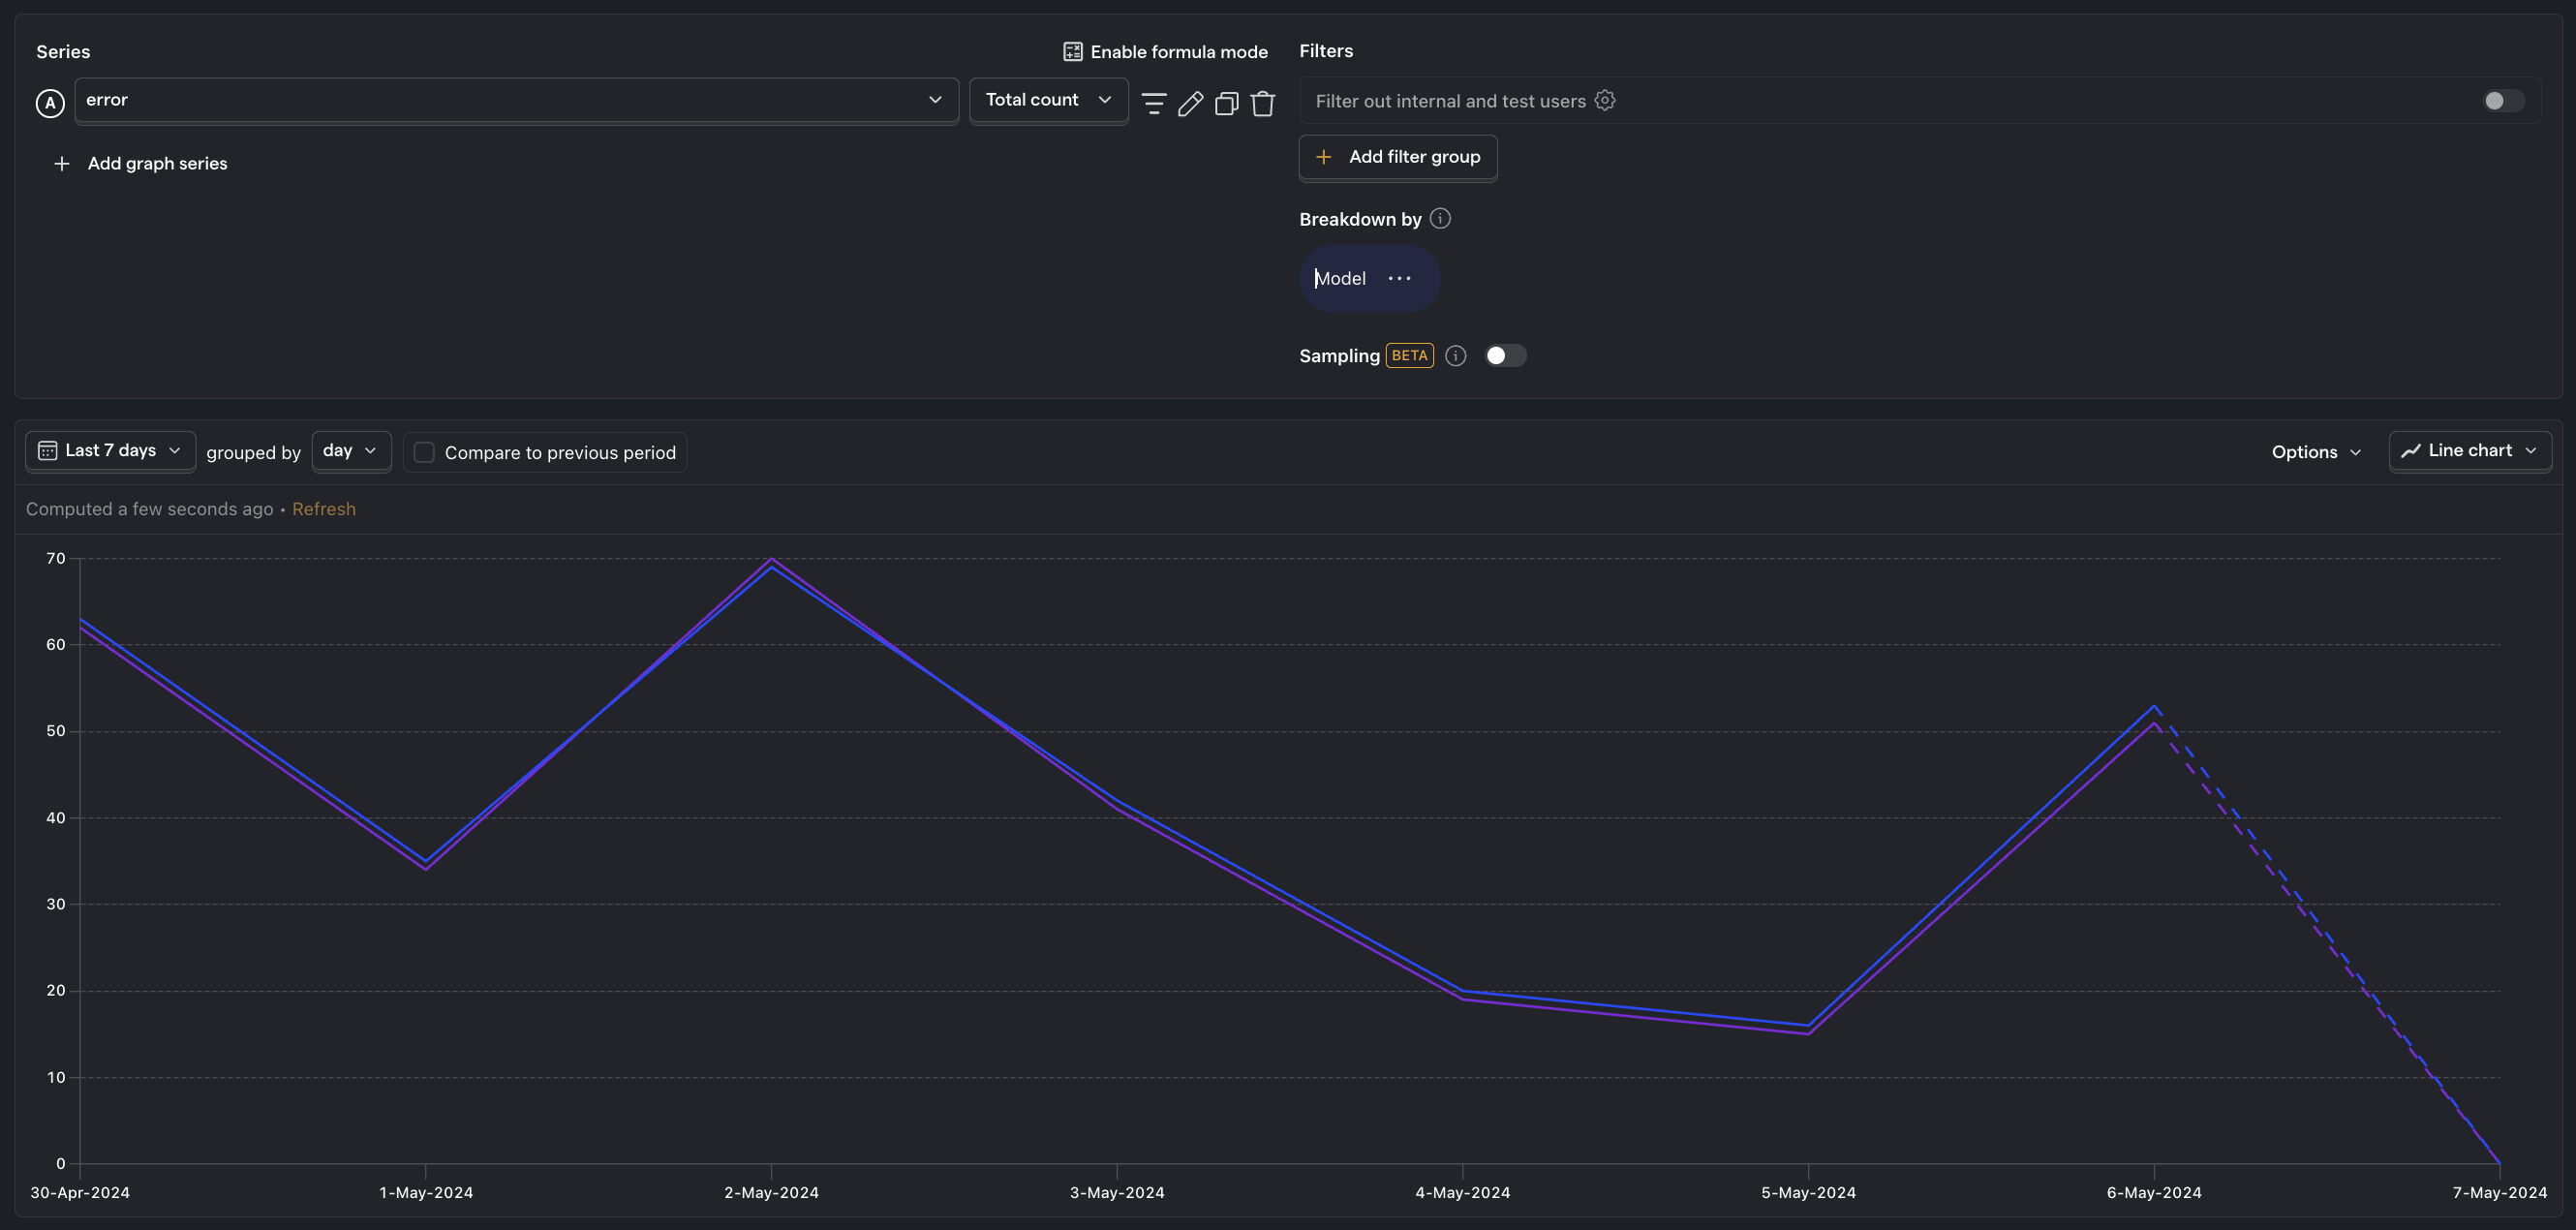
Error rate
What is it? The percentage of requests that result in errors.
Why it's useful: Enables you to pinpoint problematic LLM requests and API calls.
Questions to ask
What is the overall error rate, and how does it break down into user-facing versus backend errors?
What percentage of errors are caused by timeouts?
Are there specific features or scenarios that are more prone to errors?
Further reading


Subscribe to our newsletter
Product for Engineers
Helping engineers and founders flex their product muscles
We'll share your email with Substack